Unlock a world of possibilities! Login now and discover the exclusive benefits awaiting you.
- Qlik Community
- :
- All Forums
- :
- Qlik NPrinting
- :
- Re: Excel text function inside the excel report
- Subscribe to RSS Feed
- Mark Topic as New
- Mark Topic as Read
- Float this Topic for Current User
- Bookmark
- Subscribe
- Mute
- Printer Friendly Page
- Mark as New
- Bookmark
- Subscribe
- Mute
- Subscribe to RSS Feed
- Permalink
- Report Inappropriate Content
Excel text function inside the excel report
Hello,
I have a field called "Group" and I want to display in an excel report the right("Group", 1).
The only way I found is to display <Group> value in the column, then to hide the column and create an excel function
= right(colname, 1).
I also tried to create a variable.
I put the formula
=right([Group], 1)
But when I display the variable, I don't have what I want.
Any ideas?
Nikos
Accepted Solutions
- Mark as New
- Bookmark
- Subscribe
- Mute
- Subscribe to RSS Feed
- Permalink
- Report Inappropriate Content
Hi,
Qlik NPrinting formulas must return a single value, not an array, as documented in https://help.qlik.com/en-US/nprinting/May2022/Content/NPrinting/ReportsDevelopment/Formulas.htm#anch.... You cannot get a column of values by simple adding a formula as wrote in previous posts.
The best solutions are:
- Create a new field in the Qlik Sense reload script (pro: one time calculation only during reload. cons: you have to change the reload script)
- Create a native Excel table, add a table formula using Excel syntax and hide the source column. Qlik NPrinting will propagate the formula during report generation. Details are explained in https://help.qlik.com/en-US/nprinting/May2022/Content/NPrinting/ExcelReports/Make-Calculated-Column.....
Both those solutions are fast during reports generation, the first is faster and it is the one I suggest every time the scenario lets you to move the calculations on the reload script.
I strongly suggest you to avoid to use the following solution. It uses Qlik NPrinting formulas but it is very slow because it uses levels and each value of a level is a filter so you have to wait that the filter is applied and resultiv row of values returned. This will increase the report generation time that can become not acceptable in particular with huge reports. This was the only way to create tables with version of Excel before 2007 that was the first supporting native tables.
- create a level with the source straight table
- drag and drop the level tags and the fields you need inside them in the template
- create the formula using the source field and drag and drop it into the template

Each row of the source table is a filter that returns a single value used by the formula. So in this case the formula will work returning a single value.

This solution is slower, there are the two alternatives I wrote you before so I suggest you to select one of them instead of this.
Best Regards,
Ruggero
Best Regards,
Ruggero
---------------------------------------------
When applicable please mark the appropriate replies as CORRECT. This will help community members and Qlik Employees know which discussions have already been addressed and have a possible known solution. Please mark threads with a LIKE if the provided solution is helpful to the problem, but does not necessarily solve the indicated problem. You can mark multiple threads with LIKEs if you feel additional info is useful to others.
- Mark as New
- Bookmark
- Subscribe
- Mute
- Subscribe to RSS Feed
- Permalink
- Report Inappropriate Content
Hello Ruggero,
I appreciate your help and analysis.
The two best practices were exactly what I already knew.
I didn't know the reason why you can't apply the formula to all the values from a column. No I know 😊
Thanks a lot,
Nikos
- Mark as New
- Bookmark
- Subscribe
- Mute
- Subscribe to RSS Feed
- Permalink
- Report Inappropriate Content
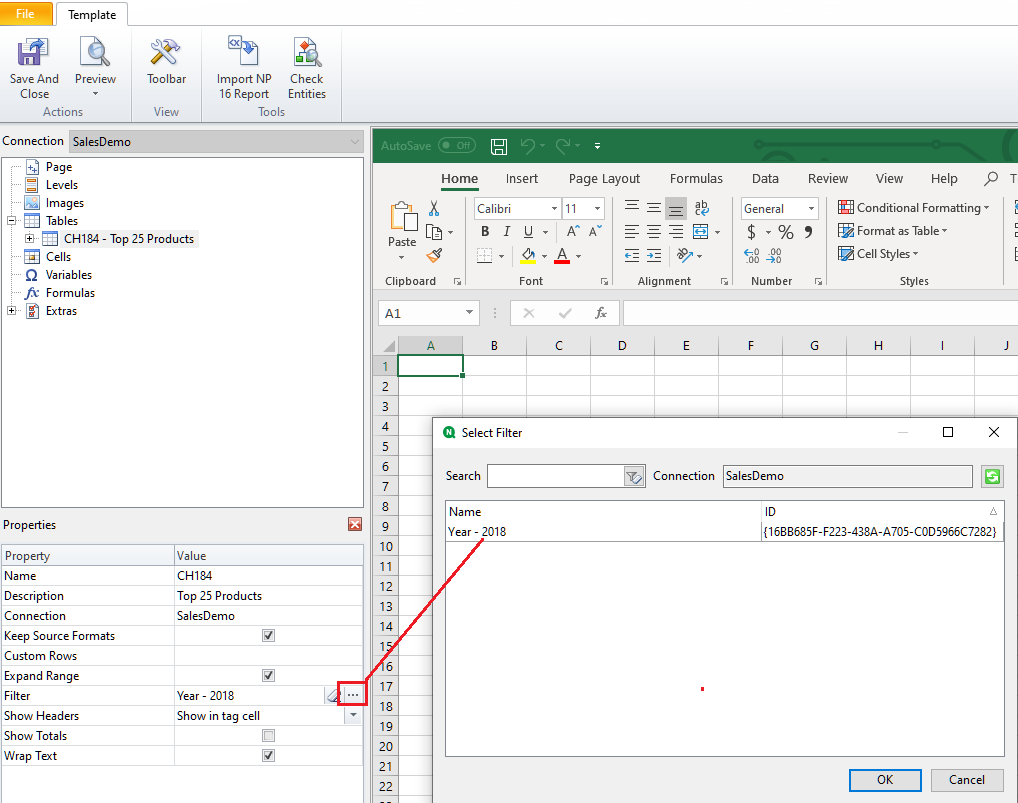
Not exactly sure what you want here so I will make an assumption and guess at what you need to do.
1. Create an NP filter called 'xgroup'
2. Add your table to the report
3. Insert your object filter
Applying a filter to an object
Kind regards...
- Mark as New
- Bookmark
- Subscribe
- Mute
- Subscribe to RSS Feed
- Permalink
- Report Inappropriate Content
Hi,
You have a field, Group, that contains many values and you want to show only the first letter on the right in your report.
The first solution you proposed, using Excel formulas in the template, is correct. You can create a native Excel table so the formula will be propagated in the column and hide the source one. Hidden Excel worksheets are also supported, so you can insert the source field in a hidden worksheet and place the formula in one visible.
Another idea is to move the formula in the Qlik data reload script by creating a new field. This moves the calculation efforts to data reload and can be an advantage because you avoid Excel calculations on all generated reports.
Best Regards,
Ruggero
Best Regards,
Ruggero
---------------------------------------------
When applicable please mark the appropriate replies as CORRECT. This will help community members and Qlik Employees know which discussions have already been addressed and have a possible known solution. Please mark threads with a LIKE if the provided solution is helpful to the problem, but does not necessarily solve the indicated problem. You can mark multiple threads with LIKEs if you feel additional info is useful to others.
- Mark as New
- Bookmark
- Subscribe
- Mute
- Subscribe to RSS Feed
- Permalink
- Report Inappropriate Content
Hi Frank,
What I want is pretty simple:
I'm having "Group 1" from my qlik sense and I want to display just "1", the last character.


I don't want to create a new column for that and make the original hidden.
Which is instead of <Group> field in column B, to display something like right(<Group>, 1).
I tried to create the following formula and display it in column C but the results are not correct as you can see.

Of course, I know that I can have the result in qlik sense. I'm wondering if I can have it somehow in nPrinting.
Thank you,
Nikos
- Mark as New
- Bookmark
- Subscribe
- Mute
- Subscribe to RSS Feed
- Permalink
- Report Inappropriate Content
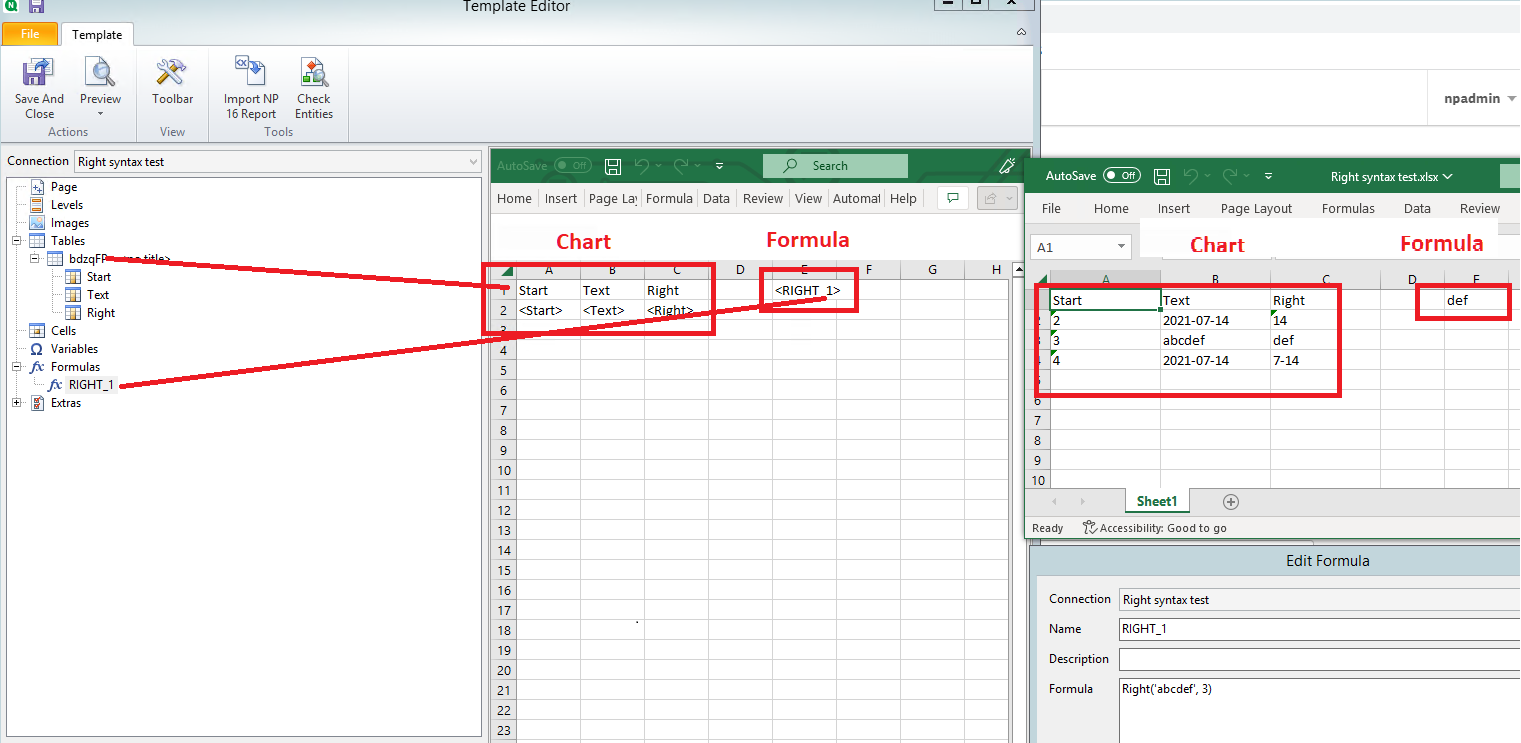
I think I understand now.
It is possible to use the formula editor to do a 'Right'. I've tested and it works.
See the example I used from this help page.
I used the load script in an new app and created a chart in Qlik Sense
I used the same syntax from this page above to create a formula in NPrinting using the formula editor.
- Right('abcdef', 3)
Not sure if this helps but here it is none the less with 'def' appearing in cell E1 in the report output.
- Mark as New
- Bookmark
- Subscribe
- Mute
- Subscribe to RSS Feed
- Permalink
- Report Inappropriate Content
Hi Frank,
In formula you used fixed text (abcdef).
So, you take right('abcdef', 3) and it worked.
But how could you make it to use a field from qlik instead?
Something like right([text], 3).
This is what I want.
Thank you for your assistance,
Nikos
- Mark as New
- Bookmark
- Subscribe
- Mute
- Subscribe to RSS Feed
- Permalink
- Report Inappropriate Content
Hi,
Qlik NPrinting formulas must return a single value, not an array, as documented in https://help.qlik.com/en-US/nprinting/May2022/Content/NPrinting/ReportsDevelopment/Formulas.htm#anch.... You cannot get a column of values by simple adding a formula as wrote in previous posts.
The best solutions are:
- Create a new field in the Qlik Sense reload script (pro: one time calculation only during reload. cons: you have to change the reload script)
- Create a native Excel table, add a table formula using Excel syntax and hide the source column. Qlik NPrinting will propagate the formula during report generation. Details are explained in https://help.qlik.com/en-US/nprinting/May2022/Content/NPrinting/ExcelReports/Make-Calculated-Column.....
Both those solutions are fast during reports generation, the first is faster and it is the one I suggest every time the scenario lets you to move the calculations on the reload script.
I strongly suggest you to avoid to use the following solution. It uses Qlik NPrinting formulas but it is very slow because it uses levels and each value of a level is a filter so you have to wait that the filter is applied and resultiv row of values returned. This will increase the report generation time that can become not acceptable in particular with huge reports. This was the only way to create tables with version of Excel before 2007 that was the first supporting native tables.
- create a level with the source straight table
- drag and drop the level tags and the fields you need inside them in the template
- create the formula using the source field and drag and drop it into the template
Each row of the source table is a filter that returns a single value used by the formula. So in this case the formula will work returning a single value.
This solution is slower, there are the two alternatives I wrote you before so I suggest you to select one of them instead of this.
Best Regards,
Ruggero
Best Regards,
Ruggero
---------------------------------------------
When applicable please mark the appropriate replies as CORRECT. This will help community members and Qlik Employees know which discussions have already been addressed and have a possible known solution. Please mark threads with a LIKE if the provided solution is helpful to the problem, but does not necessarily solve the indicated problem. You can mark multiple threads with LIKEs if you feel additional info is useful to others.
- Mark as New
- Bookmark
- Subscribe
- Mute
- Subscribe to RSS Feed
- Permalink
- Report Inappropriate Content
Hello Ruggero,
I appreciate your help and analysis.
The two best practices were exactly what I already knew.
I didn't know the reason why you can't apply the formula to all the values from a column. No I know 😊
Thanks a lot,
Nikos