- Mark as New
- Bookmark
- Subscribe
- Mute
- Subscribe to RSS Feed
- Permalink
- Report Inappropriate Content
How to not send email if no data is found after filtering? Issues with chart condition.
Hello,
I have an excel report that I'm filtering a query data set to only include IDs where the failure percentage is greater than .3 or 30% and where a field called database is equal to a certain value on the previous day.
Currently, the report that is generated looks like this:
| Date | ID | Failure % | Failure Count | Total Queries |
| 20210719 | 01 | 100.0% | 3 | 3 |
I wanted to avoid sending an error email if no IDs are found to be above the threshold of 30%. After looking around, it appeared I could create a chart that had these same parameters and use it as a chart condition.
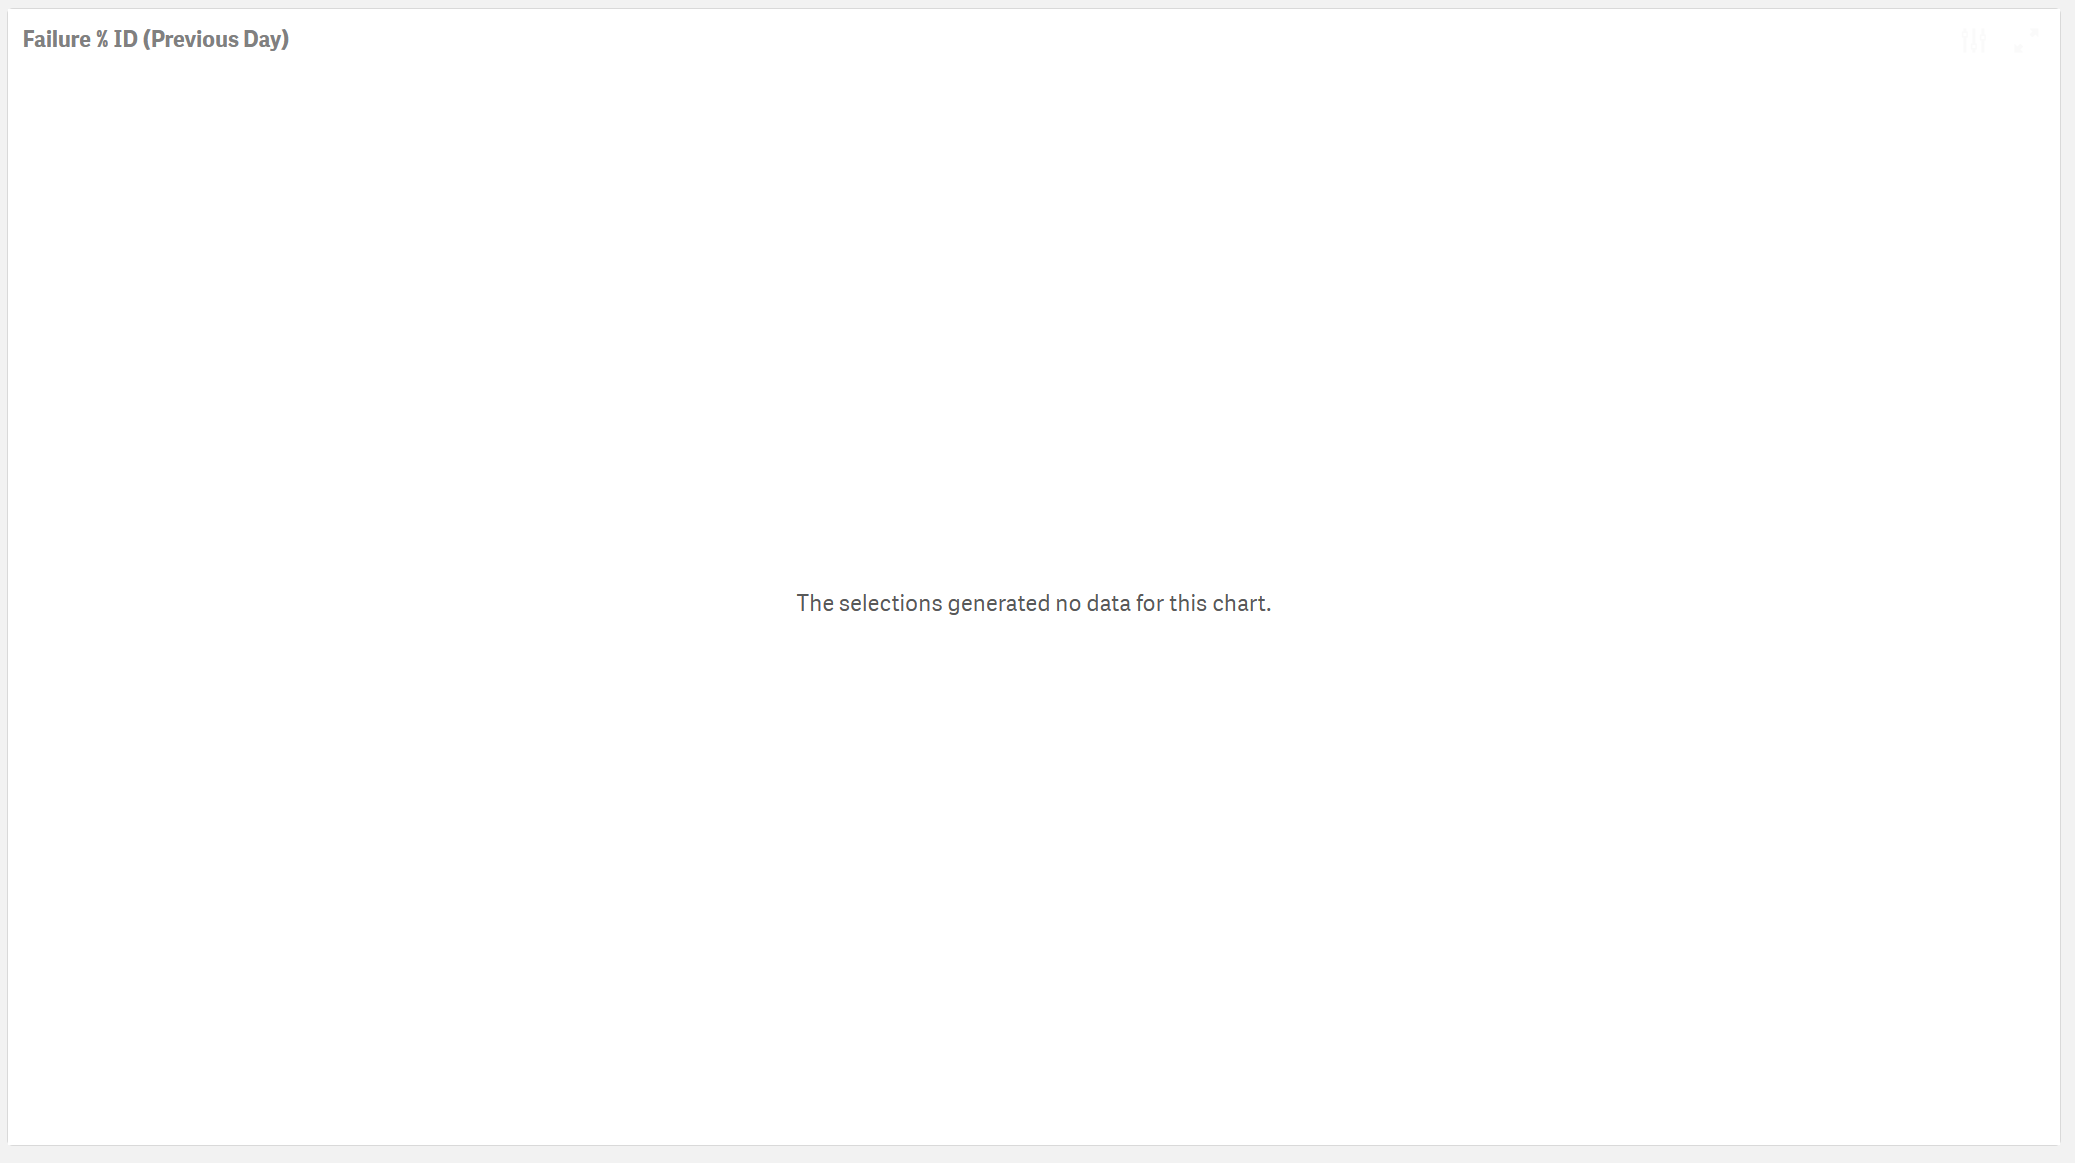
Weirdly, when I made the chart it doesn't display data unless I select a database. I've attached screenshots of this behavior. Due to my task filtering to a single database anyway, I'm hoping this isn't causing the following issue.
Once I setup the nPrint condition to be true if the chart has values, the task error-ed when ran. Error example below:
Execution for task [taskID] failed for an exception System.Exception: Exception during content resolution while processing request with id [requestID]. Check Engine logs for details. ERROR: Export of data of object with id [objectID] of type barchart is not supported. No report will be generated.
I tried using a pie chart instead but got the same error with only the type referenced being changed.
Is this a compatibility issue between my chart and the chart condition feature? I couldn't find a compatibility list when searching earlier.
It's worth noting that I attempted to run the task with my report disabled and I didn't get the same error, which makes me suspect that it isn't a compatibility issue.
Any recommendations for how to make this work, or a better solution to achieve my overall goal is much appreciated.
Thanks!
Accepted Solutions
- Mark as New
- Bookmark
- Subscribe
- Mute
- Subscribe to RSS Feed
- Permalink
- Report Inappropriate Content
Try this:
- clone/copy the chart
- convert the clone/copy to a straight table
- use the straight table with your condition rule
let us know how that goes...
kind regards...
- Mark as New
- Bookmark
- Subscribe
- Mute
- Subscribe to RSS Feed
- Permalink
- Report Inappropriate Content
The "databases" I was referring to was actually the name of a dimension.
I'm actually the developer, and you're correct that I utilized both set analysis and the limitation feature of dimensions to limit the chart to the previous days data and only failure % above the established limit/threshold.
That said, I think I found the solution to the data not populating when a database is not selected. I had the limitation mode set to "relative value", not sure why but when I switched it to "exact value" it worked as expected.
Thanks anyway though!
- Tags:
- limitation
- Mark as New
- Bookmark
- Subscribe
- Mute
- Subscribe to RSS Feed
- Permalink
- Report Inappropriate Content
Try this:
- clone/copy the chart
- convert the clone/copy to a straight table
- use the straight table with your condition rule
let us know how that goes...
kind regards...
- Mark as New
- Bookmark
- Subscribe
- Mute
- Subscribe to RSS Feed
- Permalink
- Report Inappropriate Content
I think this may have worked, any idea why the table is blank unless a database is selected? I'm going to monitor the task and see if it continues to work when no data is found.
Thanks!
- Mark as New
- Bookmark
- Subscribe
- Mute
- Subscribe to RSS Feed
- Permalink
- Report Inappropriate Content
It's not possible to select 'databases' from Qlik Sense apps so not sure what you mean on this point.
You can however make dimension value selections in list, multiboxes, selecting an area of a chart etc.
Based on what I see in the message The developer of the dashboard has included a conditional message to ensure a selection is made which produces data to enable the chart
.
- 'the selections generated no data for this chart'
See the following community post for one possible solution.
- Mark as New
- Bookmark
- Subscribe
- Mute
- Subscribe to RSS Feed
- Permalink
- Report Inappropriate Content
The "databases" I was referring to was actually the name of a dimension.
I'm actually the developer, and you're correct that I utilized both set analysis and the limitation feature of dimensions to limit the chart to the previous days data and only failure % above the established limit/threshold.
That said, I think I found the solution to the data not populating when a database is not selected. I had the limitation mode set to "relative value", not sure why but when I switched it to "exact value" it worked as expected.
Thanks anyway though!
- Tags:
- limitation