Unlock a world of possibilities! Login now and discover the exclusive benefits awaiting you.
- Qlik Community
- :
- All Forums
- :
- Qlik NPrinting
- :
- Re: How to show total in Nprinting V17 reports
- Subscribe to RSS Feed
- Mark Topic as New
- Mark Topic as Read
- Float this Topic for Current User
- Bookmark
- Subscribe
- Mute
- Printer Friendly Page
- Mark as New
- Bookmark
- Subscribe
- Mute
- Subscribe to RSS Feed
- Permalink
- Report Inappropriate Content
How to show total in Nprinting V17 reports
Hi All,
I have straight table and pivot table reports in my Qlikview dashboard and I have scheduled it in Nprinting version17.
Now what I am seeing is, reports are showing in nprinting but without total column as the total column is in my Qlikview report but Nprinting 17 showing all columns of Qlikview reports except Total column.
Please tell me how to show total column along with another column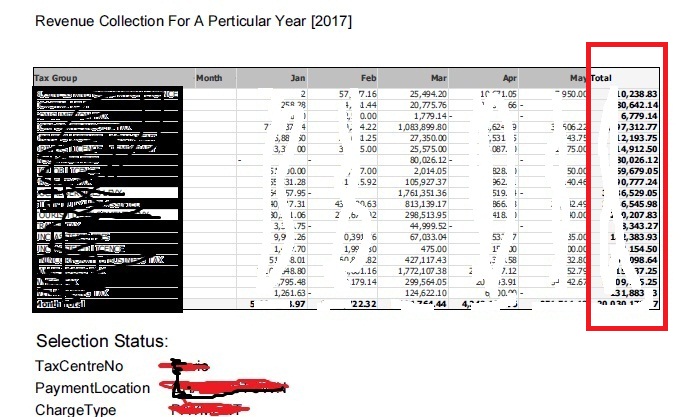 of the straight table as well as of pivot table.
Please see the below image of Qlikview report with Total column highlighted and I want to show the same report in Nprinting17 with the Total column as highlighted in the image.
Thanks
Narender
- « Previous Replies
-
- 1
- 2
- Next Replies »
Accepted Solutions
- Mark as New
- Bookmark
- Subscribe
- Mute
- Subscribe to RSS Feed
- Permalink
- Report Inappropriate Content
Please refer to this guide it is for 16 but the principle works for 17 as I've used it.
How to Create Excel Reports with Nested Levels and Subtotals
- Mark as New
- Bookmark
- Subscribe
- Mute
- Subscribe to RSS Feed
- Permalink
- Report Inappropriate Content
Nprinting doesn't bring through to total value. You have to create it yourself when bringing in a table.
I added the table to my work sheet with the fields I want to see. Column name in B1 field value in B2
I then left a space between the field and where I want to display the total. B4
I then added a formula in cell B4 to create the total SUM(B2:B3)
If you don't leave the space it won't work.
- Mark as New
- Bookmark
- Subscribe
- Mute
- Subscribe to RSS Feed
- Permalink
- Report Inappropriate Content
Hi All,
If Totals are not supported in NPrinting why dont we create totals by ourselfs as part of grouping dimension?
Here is my recipie how to deal with it:
This is solution/workaround which can be used in both: QlikView & Sense as well as for pivot and straight tables.
Lets just assume we want to create table where we want to look at sales by Customer and have Total $ and Total %
First step is to create additional grouped dimension by applying script from below. It creates total for all available values under dimension which we want to use as grouping. Next step is simply to use grouped dimension field as your dimension WITHOUT Totals as totals will be created automaticly.
Obviously then you have to just take care of proper sorting which is fairly easy.
Attached is sample app with this result :

| Customers: | |
| LOAD | |
| FIELDVALUE('%CustomerId',ITERNO()) AS %CustomerId, |
FIELDVALUE('%CustomerId',ITERNO()) AS Customer2
| AUTOGENERATE | |
| (1) | |
| WHILE | |
| NOT ISNULL(FIELDVALUE('%CustomerId',ITERNO())) |
;
Concatenate (Customers)
Load DISTINCT
| %CustomerId, | ||
| 'Total' | as Customer2 | |
| Resident | ||
| Customers | ||
| ; |
hope this helps
regards
Lech
- Mark as New
- Bookmark
- Subscribe
- Mute
- Subscribe to RSS Feed
- Permalink
- Report Inappropriate Content
Hi lech
You can total it just takes a little effort to do it. your proposed way adds to the time it will take to generate the report.
By adding the totals into the excel sheet itself then it show be quicker to process than having qlik retotal each time. same issue you have when you decide to bring in other on limitations.
Regards
Andy
- Mark as New
- Bookmark
- Subscribe
- Mute
- Subscribe to RSS Feed
- Permalink
- Report Inappropriate Content
Hi Andy,
I agree that it will require Qlik to calculate total, but we are talking about nano-seconds - right? I am supporting your solution as long as it serves the purpose!
But - Your solution is good as long as you are ok to put totals at the end or at the far right side. What do you do if you need to put totals in the second row, below headers?, or in pivot view right after dimensions? That is where my option can be used
To create those group total dimension in script is very simple and easy as we are using FieldValue() and While statement - on whole reload you would loose 1-4 seconds usually.
Regarding "Others" and Calculated dimensions or Dimension limits with NPrinting - that is separate topic-more complicated i think.
regards
Lech
- Mark as New
- Bookmark
- Subscribe
- Mute
- Subscribe to RSS Feed
- Permalink
- Report Inappropriate Content
Please refer to this guide it is for 16 but the principle works for 17 as I've used it.
How to Create Excel Reports with Nested Levels and Subtotals
- Mark as New
- Bookmark
- Subscribe
- Mute
- Subscribe to RSS Feed
- Permalink
- Report Inappropriate Content
Andy,
this is straight table example, and it will work. Not sure whether you could put total between header and the rest of records though? Example shows total on the bottom of the table.
note that i mentioned totals in PIVOT right after dimension (verticaly)
cheers
Lech
- Mark as New
- Bookmark
- Subscribe
- Mute
- Subscribe to RSS Feed
- Permalink
- Report Inappropriate Content
The principle should be the same no matter where you locate the total.
As with all things at some point we have to try things out.
Piviots in nprinting as you know aren't supported directly from sense unless you bring it in as an image.
- Mark as New
- Bookmark
- Subscribe
- Mute
- Subscribe to RSS Feed
- Permalink
- Report Inappropriate Content
Agree on that 
- Mark as New
- Bookmark
- Subscribe
- Mute
- Subscribe to RSS Feed
- Permalink
- Report Inappropriate Content
Hi Andy,
Thanks for the sharing such a great article. Its working for straight table.
Can you let me know how i can apply it in pivot?
Thanks,
Narender
- « Previous Replies
-
- 1
- 2
- Next Replies »