Unlock a world of possibilities! Login now and discover the exclusive benefits awaiting you.
- Qlik Community
- :
- All Forums
- :
- Qlik NPrinting
- :
- Re: NPrinting 16 - Chart and table side to side
- Subscribe to RSS Feed
- Mark Topic as New
- Mark Topic as Read
- Float this Topic for Current User
- Bookmark
- Subscribe
- Mute
- Printer Friendly Page
- Mark as New
- Bookmark
- Subscribe
- Mute
- Subscribe to RSS Feed
- Permalink
- Report Inappropriate Content
NPrinting 16 - Chart and table side to side
Hi everyone,
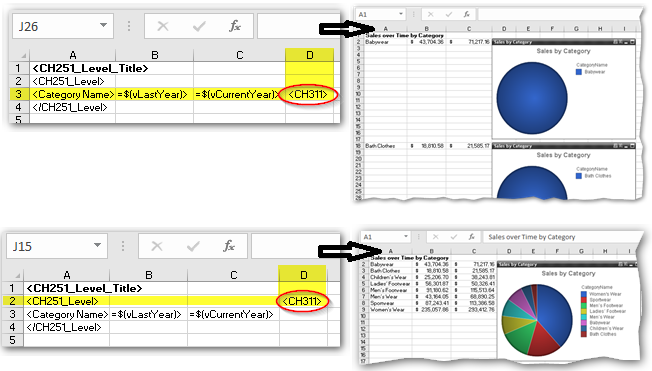
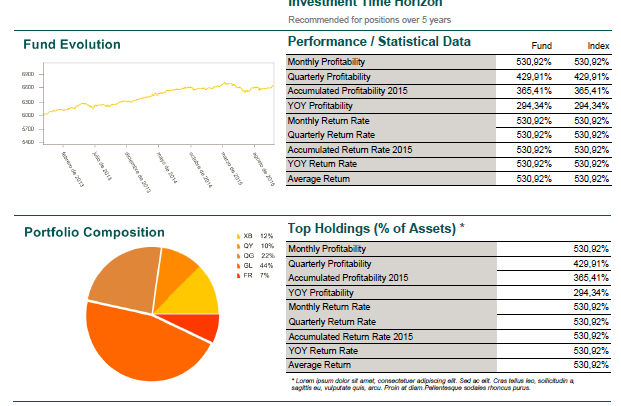
Our customer has requested us to create a report with a table and a pie chart. He wants the chart and the table side to side but when using leves to create a table I can't put the chart on the left of the table because it repeats as many times as rows has the table.
Anyone knows a way to put a chart on the side of a table using levels? djk help will be much apreciated.
Thanks in advance.
Regards.
- Tags:
- nprinting 16.5
- « Previous Replies
-
- 1
- 2
- Next Replies »
- Mark as New
- Bookmark
- Subscribe
- Mute
- Subscribe to RSS Feed
- Permalink
- Report Inappropriate Content
Hi Jesus,
If your image is within the Level tags try moving it out.

HTH - Daniel.
- Mark as New
- Bookmark
- Subscribe
- Mute
- Subscribe to RSS Feed
- Permalink
- Report Inappropriate Content
Hi Daniel,
Sorry, my mistake not to specify that it must be done into a Pixel Perfect report.
Our customer want it into PDF format instead Excel.
Thanks for your quick response.
Regards.
- Mark as New
- Bookmark
- Subscribe
- Mute
- Subscribe to RSS Feed
- Permalink
- Report Inappropriate Content
Hi, Jesus,
Excel report in nprinting can output as pdf by changing the output format.
So if Daniel's solution works, you can use it.
Zhihong
- Mark as New
- Bookmark
- Subscribe
- Mute
- Subscribe to RSS Feed
- Permalink
- Report Inappropriate Content
Hy,
can someone explain it, how to manage this Issue in PixelPerfect? On Qlik.com there is a example Pixelperfect Report, which contain this - so i think it must be possible ![]()

thx
Aaron
- Mark as New
- Bookmark
- Subscribe
- Mute
- Subscribe to RSS Feed
- Permalink
- Report Inappropriate Content
Hi Aaron,
That's exactly what I want to do but I haven't find any tutorial or example to do this.
Regards.
- Mark as New
- Bookmark
- Subscribe
- Mute
- Subscribe to RSS Feed
- Permalink
- Report Inappropriate Content
Hy Jesus, hope someone can help us ![]()
i stay tuned
br
- Mark as New
- Bookmark
- Subscribe
- Mute
- Subscribe to RSS Feed
- Permalink
- Report Inappropriate Content
Dear all,
has anyone a solution to arrange two tables side by side?
This seemd to be the same problem as discribed above?
Thx
Matthias
- Mark as New
- Bookmark
- Subscribe
- Mute
- Subscribe to RSS Feed
- Permalink
- Report Inappropriate Content
Hi Mathias,
It seems that doing this in Pixel Perfect reports is not possible using "levels" to construct hte tables. The only way to do it is using the image option, capturing an image directly form the document tables, but this is the worst workaround under my opinion. Hope this will be possible in NPrinting 17 but I don't think so.
Hope someone help us. Maybe djk has another workaround.
Regards.
- Mark as New
- Bookmark
- Subscribe
- Mute
- Subscribe to RSS Feed
- Permalink
- Report Inappropriate Content
Hi Jesus,
did you ever find a solution to this issue? What did you end up doing? I have a similar request and struggling to implement.
thanks
- « Previous Replies
-
- 1
- 2
- Next Replies »