Unlock a world of possibilities! Login now and discover the exclusive benefits awaiting you.
- Qlik Community
- :
- All Forums
- :
- Qlik NPrinting
- :
- Re: NPrinting and Horizontal Straight Table
- Subscribe to RSS Feed
- Mark Topic as New
- Mark Topic as Read
- Float this Topic for Current User
- Bookmark
- Subscribe
- Mute
- Printer Friendly Page
- Mark as New
- Bookmark
- Subscribe
- Mute
- Subscribe to RSS Feed
- Permalink
- Report Inappropriate Content
NPrinting and Horizontal Straight Table
Hello All -
I have a series of straight tables that are Horizontal (check box on the Presentation tab)
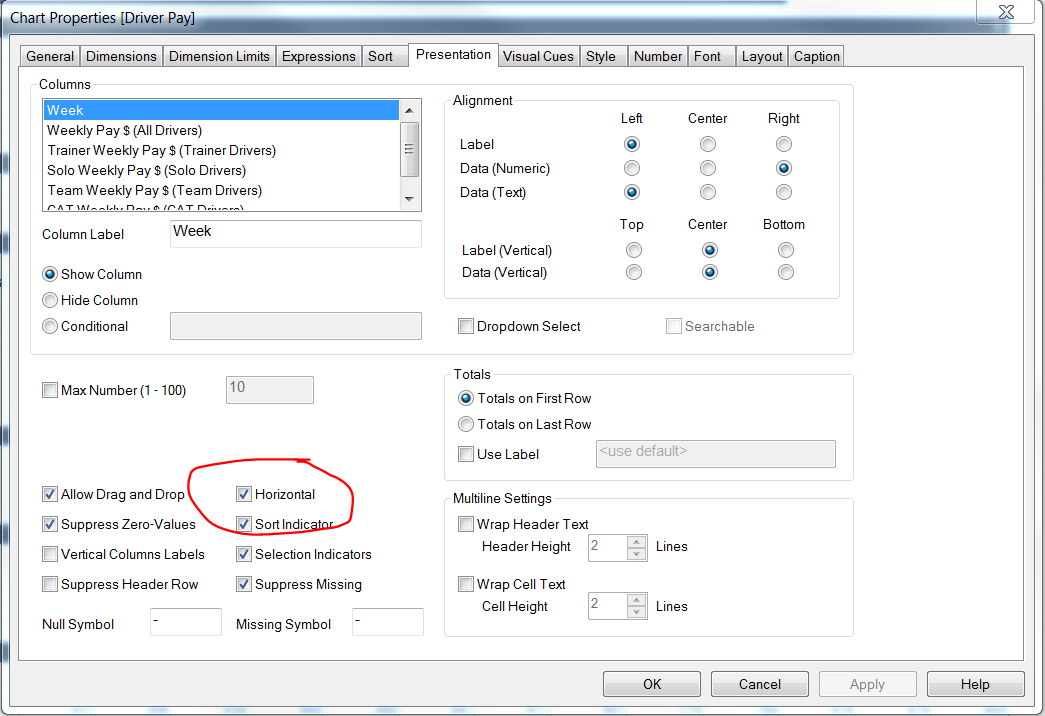
When I create an Excel report, NPrinting ignores that setting and prints the report as if Horizontal wasn't checked. Is there a way to print the tables correctly?
Thanks,
- Tags:
- nprinting..
- Mark as New
- Bookmark
- Subscribe
- Mute
- Subscribe to RSS Feed
- Permalink
- Report Inappropriate Content
I don't have a good answer. Could you make it work as a Pivot Table instead of a horizontal straight table?
- Mark as New
- Bookmark
- Subscribe
- Mute
- Subscribe to RSS Feed
- Permalink
- Report Inappropriate Content
I was hoping not to. It tends to be a lot more difficult to make a pivot look nice.
- Mark as New
- Bookmark
- Subscribe
- Mute
- Subscribe to RSS Feed
- Permalink
- Report Inappropriate Content
Michael,
NPrinting can only use the default x y dimensions of the chart. Essentially changing the axis using the horizontal property cannot be managed by NPrinting.
If you would like the report to appear that way, Randi's idea could work or you can use NPrinting cell by cell reporting to accomplish this. For more information, watch the advance training video which can be found in the link below:
Let it load and scroll to 52min25seconds for the cell by cell report.
The disadvantage of this method is that it's time intensive and it can only be used for a specific number of rows.
hope this helps.
- Mark as New
- Bookmark
- Subscribe
- Mute
- Subscribe to RSS Feed
- Permalink
- Report Inappropriate Content
Michael,
Unfortunately, DataGrrl sent you the correct answer.
You'll have to load the data into Excel and use it to populate an Excel pivot table.
Best
Aran
- Mark as New
- Bookmark
- Subscribe
- Mute
- Subscribe to RSS Feed
- Permalink
- Report Inappropriate Content
OK, thank you.
- Mark as New
- Bookmark
- Subscribe
- Mute
- Subscribe to RSS Feed
- Permalink
- Report Inappropriate Content
Michael
another possible option, and it would depend on the size of the table, but if the table does not cross over pages, would you be able to bring the object into nprinting as an iamge?
- Mark as New
- Bookmark
- Subscribe
- Mute
- Subscribe to RSS Feed
- Permalink
- Report Inappropriate Content
Not in this case. My end users like to have the actual data. But thank you!
- Mark as New
- Bookmark
- Subscribe
- Mute
- Subscribe to RSS Feed
- Permalink
- Report Inappropriate Content
Hi,
I had the same issue with an horizontal straight table to display into an Nprinting HTML report.
I found a solution to this using Levels objects.
So my users would display that chart with countries as dimension.

As the country is a dimension the number of column can change.
So I created a "level object" using the filed country of my table.

Levels object will allow me to loop over values of a field.
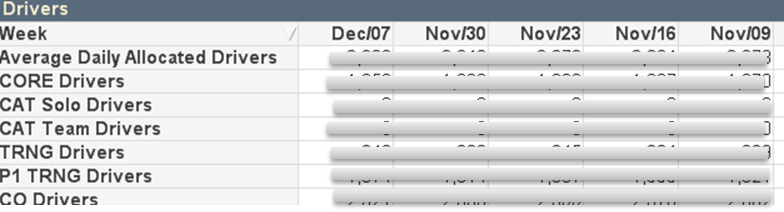
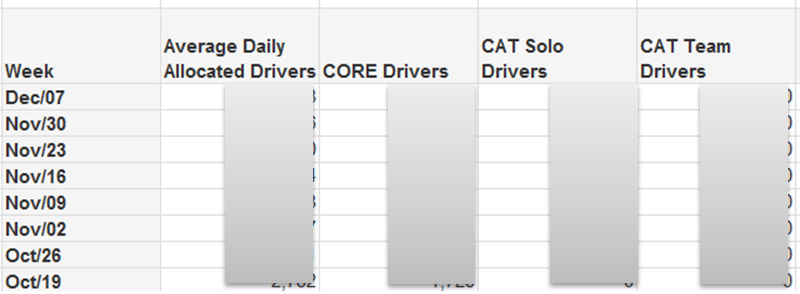
Then in qlikview I used hide field option to hide the country dim, tick the "supress header" and finally untick horizontal display.
This is the result:

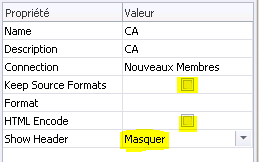
After that, In Nprinting I imported my Table.
For each field, I unticked every "Source format" or "HTML Encode" option and selected "Hide" on Show Headers:

At last in my Nprinting Template I wrote this:

As Level Section on "Last_site" will loop over each value of country dimension, it will create a new column "<TD>" for each value.
I used it in the same way for expressions.
And there it is.
The result generated in HTML with CSS style applied:

As the Section object is also available in Excel templates I think you can do the same.
Hope it will help.
- Mark as New
- Bookmark
- Subscribe
- Mute
- Subscribe to RSS Feed
- Permalink
- Report Inappropriate Content
Hi ,
I have just installed Nprinintg and made app, connection to Qliksense, Report created, opened Edit template of Pixel perfect with no issues.
Now i need to add chart or table Objects to levels i am not able to do so. Only variable objects in qliksense edit loader is shown.
For me its happening like this in Field list of Pixel perfect
1.) For Levels: i am able to add/shown only variable objects when i right click on levels.Even for sub levels happens same
2.)For Images and Tables : Chart and Table objects are shown to add like objects. No variable objects.
I am following
How to Create a Simple PixelPerfect Report
My understanding is that if you make connection to app succefully you should be able to add any kind of objects in app from qliksense to Nprinting. But in my scenerio it shows only variable objects or only table objects to add.
please explain why it is happening like this or what i am doing wrong.