Unlock a world of possibilities! Login now and discover the exclusive benefits awaiting you.
- Qlik Community
- :
- All Forums
- :
- Qlik NPrinting
- :
- NPrinting shows only one row of table, need all
- Subscribe to RSS Feed
- Mark Topic as New
- Mark Topic as Read
- Float this Topic for Current User
- Bookmark
- Subscribe
- Mute
- Printer Friendly Page
- Mark as New
- Bookmark
- Subscribe
- Mute
- Subscribe to RSS Feed
- Permalink
- Report Inappropriate Content
NPrinting shows only one row of table, need all
Dear Community,
inside a pixel perfect report i add a report header and a detail band.
After that i added a table object and inside the table header i defined the headers of the table and inside the detail band the columns that have a data binding.

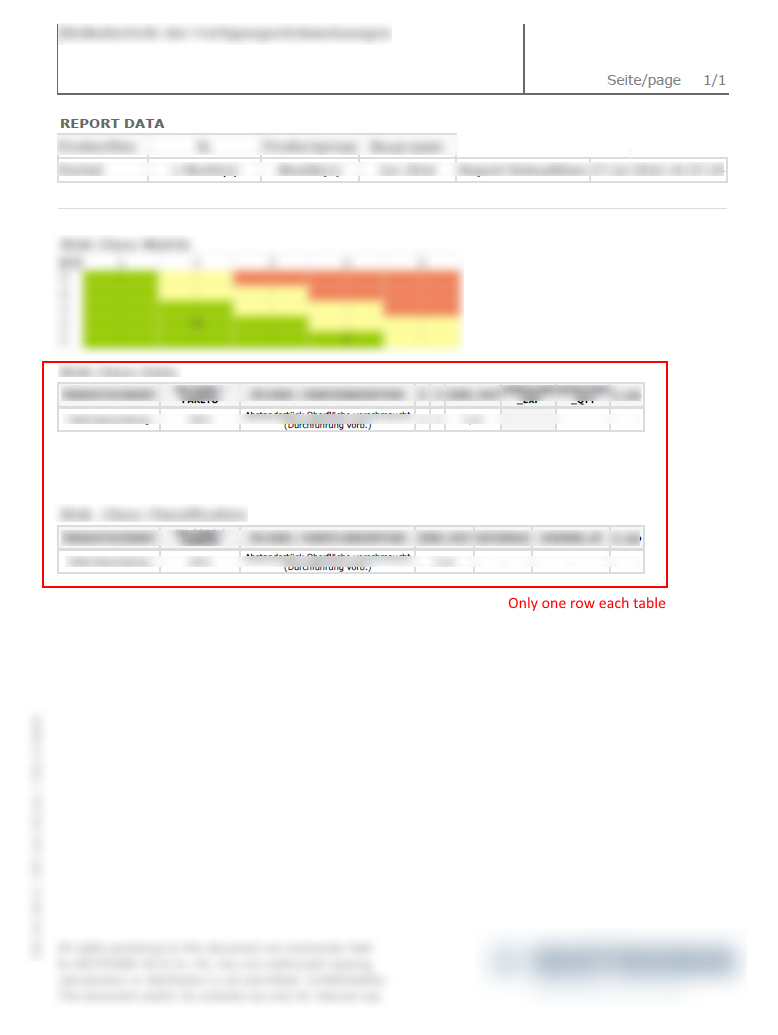
When i preview the result, i see only one (the first) row and NOT all the rows of the table.
What did i wrong?
Please help
- « Previous Replies
-
- 1
- 2
- Next Replies »
- Mark as New
- Bookmark
- Subscribe
- Mute
- Subscribe to RSS Feed
- Permalink
- Report Inappropriate Content
No one can help?
this is really important as i get only the first row of all tables actually.
I need all rows of an table!
- Mark as New
- Bookmark
- Subscribe
- Mute
- Subscribe to RSS Feed
- Permalink
- Report Inappropriate Content
The template should look something like the attached image.
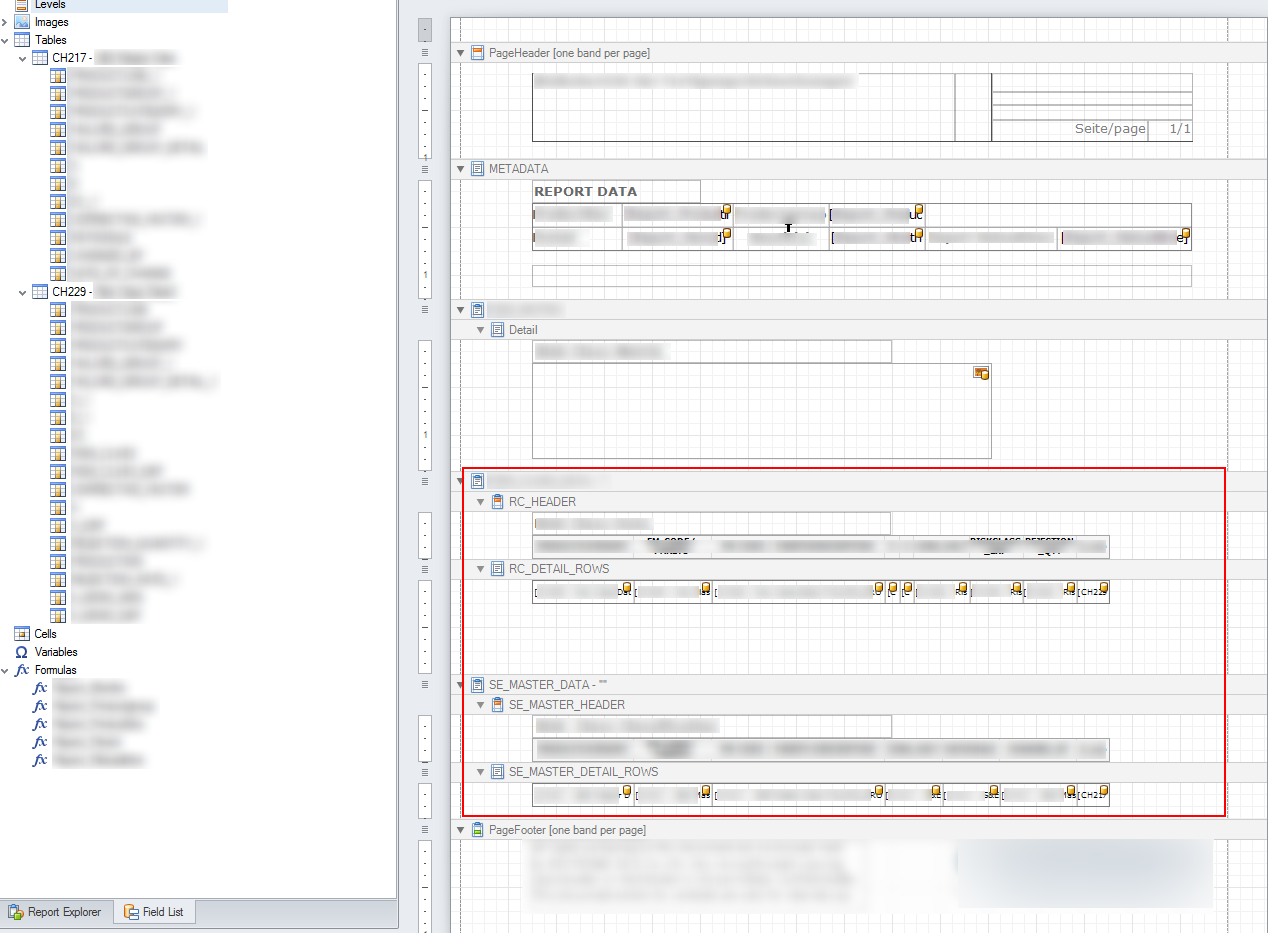
If you send a screen shot with the entire Field list expanded as well as another screen shot of the template grid (the right hand side where you drag and drop fields and create headers...) that would help
- Mark as New
- Bookmark
- Subscribe
- Mute
- Subscribe to RSS Feed
- Permalink
- Report Inappropriate Content
Hi Aran,
it looks quite similar, see:

- Mark as New
- Bookmark
- Subscribe
- Mute
- Subscribe to RSS Feed
- Permalink
- Report Inappropriate Content
Try adding your charts as levels and not as tables.
That should fix the issue.
The levels node is at the top, above "Images".
- Mark as New
- Bookmark
- Subscribe
- Mute
- Subscribe to RSS Feed
- Permalink
- Report Inappropriate Content
If using levels and just drag and drop everything inside the sheet the preview comes never back.
If Using a levels field inside a table i get following error:

- Mark as New
- Bookmark
- Subscribe
- Mute
- Subscribe to RSS Feed
- Permalink
- Report Inappropriate Content
try following this tutorial:
- Mark as New
- Bookmark
- Subscribe
- Mute
- Subscribe to RSS Feed
- Permalink
- Report Inappropriate Content
Hi Aran, we are already following this tutorial. Every time we use levels we get the "preview request failed with message" error (see my last message). I opened a support ticket @ qlik.
- Mark as New
- Bookmark
- Subscribe
- Mute
- Subscribe to RSS Feed
- Permalink
- Report Inappropriate Content
Hi,
Even i am facing the same issue, i am getting only first row in table.
how did you solve that issue?
Regards
- Mark as New
- Bookmark
- Subscribe
- Mute
- Subscribe to RSS Feed
- Permalink
- Report Inappropriate Content
Hi Supriya,
after consultation with Qlik, it seems that is an offical bug ![]() .
.
I do not have any information, when it will be solved.
- « Previous Replies
-
- 1
- 2
- Next Replies »