Unlock a world of possibilities! Login now and discover the exclusive benefits awaiting you.
- Qlik Community
- :
- All Forums
- :
- Qlik NPrinting
- :
- Re: Native PowerPoint charts in Qlik NPrinting Jun...
- Subscribe to RSS Feed
- Mark Topic as New
- Mark Topic as Read
- Float this Topic for Current User
- Bookmark
- Subscribe
- Mute
- Printer Friendly Page
- Mark as New
- Bookmark
- Subscribe
- Mute
- Subscribe to RSS Feed
- Permalink
- Report Inappropriate Content
Native PowerPoint charts in Qlik NPrinting June 2017 with Qlik Sense
Good morning everyone,
I have a great question for those that know the functionality of the native charts in PowerPoint. I was able to build a great pie chart no problem at all.
My question is about a second bar chart report that I must build. The bar chart has two dimensions being business segment and year and one measure of overall revenue. I cannot seem to figure out how to build a bar chart with two dimensions through the native powerpoint functionality. I watched a video that explained how to do it on one dimension, which is you insert a chart and the excel pops up and you plug in your table nodes into the excel - this worked great being only one dimension.
Can someone help me do this? Whether I need to place the nodes in the pop-up excel differently or if I need to do something else? Thanks so much.
- Tags:
- nprinting
- « Previous Replies
-
- 1
- 2
- Next Replies »
- Mark as New
- Bookmark
- Subscribe
- Mute
- Subscribe to RSS Feed
- Permalink
- Report Inappropriate Content
will give you example over the weekend as i am responding from my MacBook at the moment...
- Mark as New
- Bookmark
- Subscribe
- Mute
- Subscribe to RSS Feed
- Permalink
- Report Inappropriate Content
Hi Lech,
I would really appreciate the example.
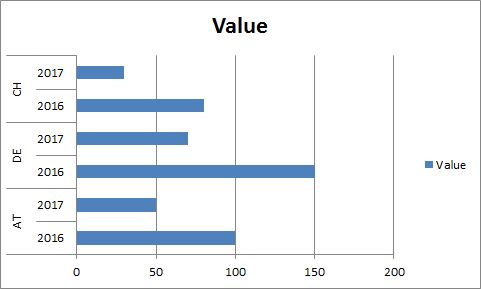
I spent a lot of time trying to create chart as below but was not able to export the data correctly.The gaps between countries were ruining the export somewhere between QV/NP/PPT.
This was in both 16 and 17 some time ago (before 17.3). I did not test it in recent versions.
Thanks in advance,
Matus

- Mark as New
- Bookmark
- Subscribe
- Mute
- Subscribe to RSS Feed
- Permalink
- Report Inappropriate Content
Matus,
apologies, I am not available till 17th of September.. I can look at this after 17th. Would you remind me please?
Last few weeks before my very long holidays wer hectic and i did not get a chance to be on community often.
regards
Lech
- Mark as New
- Bookmark
- Subscribe
- Mute
- Subscribe to RSS Feed
- Permalink
- Report Inappropriate Content
Thanks, I will remind you after 17th then.
Have a nice holiday.
Matus
- Mark as New
- Bookmark
- Subscribe
- Mute
- Subscribe to RSS Feed
- Permalink
- Report Inappropriate Content
Hi,
I did some tests in Excel and PowerPoint without involving NPrinting.
You can create an Excel bar chart with two dimensions and one measure only by using Excel pivot charts that are not supported by PowerPoint. So, in my opinion, it is not possible to create this kind of chart as a native PowerPoint chart with data from NPrinting.
In Office, as workaround, you can create an Excel pivot chart and copy and paste it into a PowerPoint.
As workaround you could try to create a single dimension by concatenating the two you want to use in the chart directly in the Qlik script, or by creating the pivot chart in Qlik and import it into the template as an image.
Best Regards,
Ruggero
---------------------------------------------
When applicable please mark the appropriate replies as CORRECT. This will help community members and Qlik Employees know which discussions have already been addressed and have a possible known solution. Please mark threads as HELPFUL if the provided solution is helpful to the problem, but does not necessarily solve the indicated problem. You can mark multiple threads as HELPFUL if you feel additional info is useful to others.
Best Regards,
Ruggero
---------------------------------------------
When applicable please mark the appropriate replies as CORRECT. This will help community members and Qlik Employees know which discussions have already been addressed and have a possible known solution. Please mark threads with a LIKE if the provided solution is helpful to the problem, but does not necessarily solve the indicated problem. You can mark multiple threads with LIKEs if you feel additional info is useful to others.
- Mark as New
- Bookmark
- Subscribe
- Mute
- Subscribe to RSS Feed
- Permalink
- Report Inappropriate Content
Hi Ruggero,
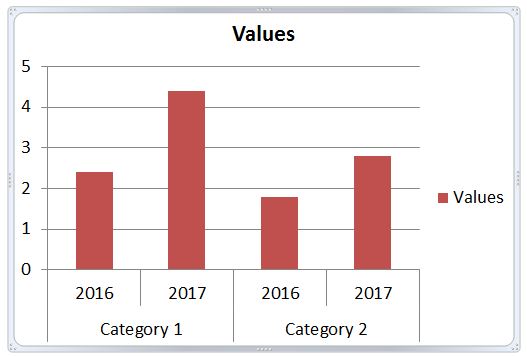
it is possible in PPT/XLS without pivot chart. You just have to have specific underlying table. The first column of the dimension needs to have value only in first line and the rest blanks. Excel then automatically creates this type of chart. (It can be a bit tricky to get it right but it is possible).
But I was not able to get it right with NP.
BR,
Matus
Chart (screenshot from ppt)

Table
| Column1 | Values | |
| Category 1 | 2016 | 2,4 |
| 2017 | 4,4 | |
| Category 2 | 2016 | 1,8 |
| 2017 | 2,8 |
- Mark as New
- Bookmark
- Subscribe
- Mute
- Subscribe to RSS Feed
- Permalink
- Report Inappropriate Content
Yes Matus,
we can achieve this in excel - you can create the custom template to achieve this without pivot table only.
you can create the same table columns with two rows of dummy data next line tags of designer columns
in between dummy data use <deleterow> tags and generate you will get the exact output.
- Mark as New
- Bookmark
- Subscribe
- Mute
- Subscribe to RSS Feed
- Permalink
- Report Inappropriate Content
That is similar to what I was doing. I was able to create the table in the template but it was always coming out incorrectly in the final output.
will give it another try.
Do you have it running in real life?
Matus
- Mark as New
- Bookmark
- Subscribe
- Mute
- Subscribe to RSS Feed
- Permalink
- Report Inappropriate Content
Please keep me posted on this progress as well. I have run into the same problems with getting it to come out correctly.
- « Previous Replies
-
- 1
- 2
- Next Replies »