Unlock a world of possibilities! Login now and discover the exclusive benefits awaiting you.
- Qlik Community
- :
- All Forums
- :
- Qlik NPrinting
- :
- Re: New Calculated field Pixel Perfect
- Subscribe to RSS Feed
- Mark Topic as New
- Mark Topic as Read
- Float this Topic for Current User
- Bookmark
- Subscribe
- Mute
- Printer Friendly Page
- Mark as New
- Bookmark
- Subscribe
- Mute
- Subscribe to RSS Feed
- Permalink
- Report Inappropriate Content
New Calculated field Pixel Perfect
Hi
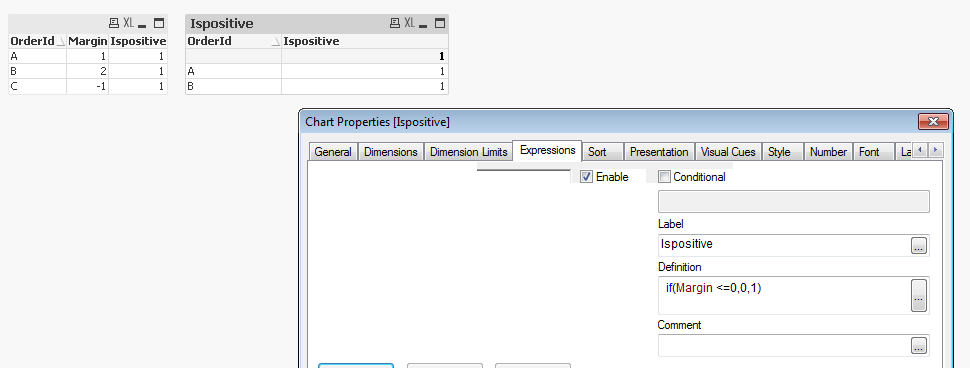
My raw table coming from Qlik is:
OrderId Margin Ispositive
A 1 1
B 2 1
C -1 1
with this table I want to create a stack bar graphic to know the percentage the positive and negative orders, anyone knows how to create the Ispositive field? if(Margin <=0,0,1)
Many thank's
Eduard
- Tags:
- if then
- Mark as New
- Bookmark
- Subscribe
- Mute
- Subscribe to RSS Feed
- Permalink
- Report Inappropriate Content
question - do you not want the stcked bar chart within the QlikView application? Alos is there a specific reason you are using PixelPerfect for a bar chart? There are other tempaltes that are a little easier to use for simple objects like bar charts, and you can use table data in excel to create bar charts within the nprinting template
- Mark as New
- Bookmark
- Subscribe
- Mute
- Subscribe to RSS Feed
- Permalink
- Report Inappropriate Content
Hi,
Could you please give some more details as you seem to have answered your own question.
Just add to you load script.
Load
*,
if(Margin <=0,0,1) AS Ispositive
Mark
- Mark as New
- Bookmark
- Subscribe
- Mute
- Subscribe to RSS Feed
- Permalink
- Report Inappropriate Content
as mark said, it looks like you answered your own question regarding as far as the logic needed in a load script
but how does that question apply to an NPrinting pixelperfect?
- Mark as New
- Bookmark
- Subscribe
- Mute
- Subscribe to RSS Feed
- Permalink
- Report Inappropriate Content
Hi Adam,
Ok, Let's change and do it in Excel, how could I do this calculation for each row?
Many thank's
Eduard
- Mark as New
- Bookmark
- Subscribe
- Mute
- Subscribe to RSS Feed
- Permalink
- Report Inappropriate Content
are u looking for this?
- Mark as New
- Bookmark
- Subscribe
- Mute
- Subscribe to RSS Feed
- Permalink
- Report Inappropriate Content
nprinting is used to take objects from qlikview and use them (or the data from the objects) to crate reports and then have then distributed. When using excel for example, you would use excel calculations to total columns or crate new columns from exisint columns.
I am not sure why you are wanting to do expression like detail withing nprinting - it should be in the load or expression and then nprinting would use the object?
Am I missing something?
- Mark as New
- Bookmark
- Subscribe
- Mute
- Subscribe to RSS Feed
- Permalink
- Report Inappropriate Content
Hi shiva,
the problem is that Margin is a looooong expresion in a set analysis, I tried to do an if in this calculation and did not work