Unlock a world of possibilities! Login now and discover the exclusive benefits awaiting you.
- Qlik Community
- :
- All Forums
- :
- Qlik NPrinting
- :
- Nprinting Pivot table issue
- Subscribe to RSS Feed
- Mark Topic as New
- Mark Topic as Read
- Float this Topic for Current User
- Bookmark
- Subscribe
- Mute
- Printer Friendly Page
- Mark as New
- Bookmark
- Subscribe
- Mute
- Subscribe to RSS Feed
- Permalink
- Report Inappropriate Content
Nprinting Pivot table issue
Hi all,
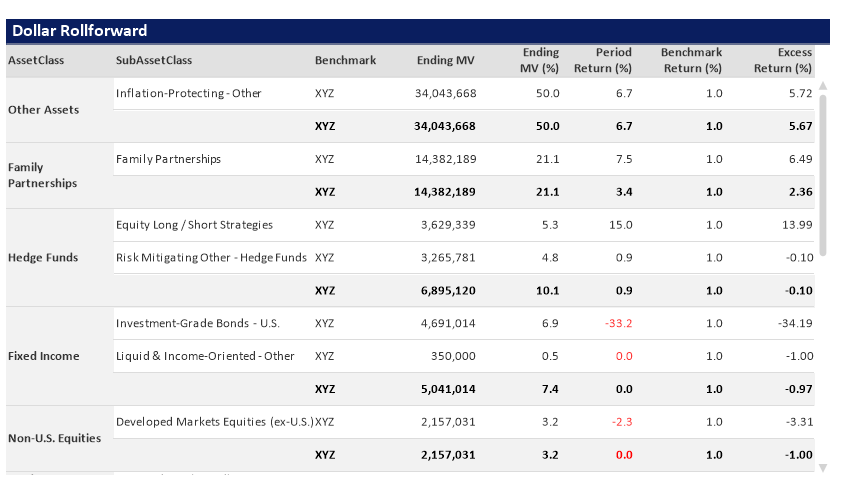
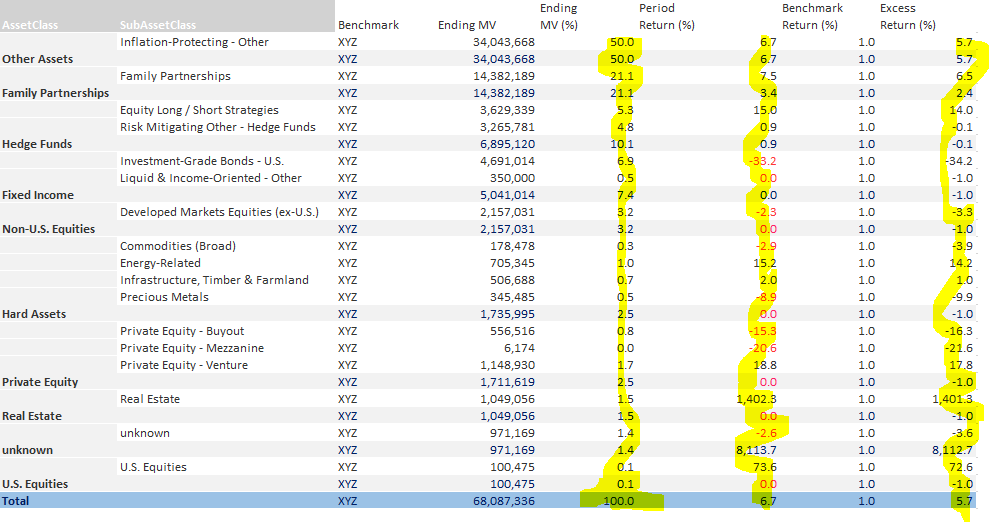
I have a pivot table in QV that looks like this.The dimension values ' Other Assets/Family Partnerships/Hedge Funds' and so on do not appear on every row instead it just shows up once but Nprinting 16 report doesn't seem to work this way.
Screenshot 1: Qlikview pivot table
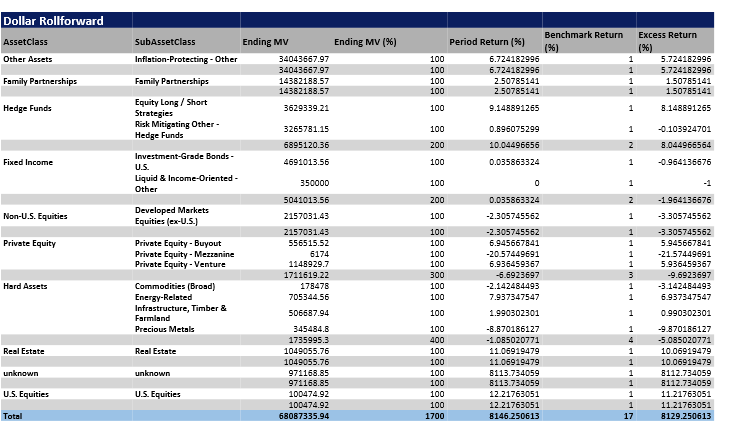
Screenshot 2: Nprinting output
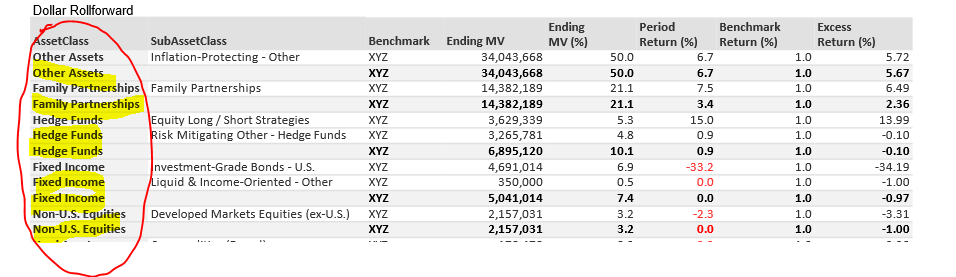
Is there a work around to make the dimension values to be displayed only once i.e in the first row for every Asset class. There is repetition on every row as highlighted in yellow which is not what we want to see in the report.
- Tags:
- @nprint pivot table
- Mark as New
- Bookmark
- Subscribe
- Mute
- Subscribe to RSS Feed
- Permalink
- Report Inappropriate Content
Hi,
What kind of template are you developing?
I suppose you added the pivot table in the tables node. In this case Qlik NPrinting does its best effort to keep the source formats but sometimes it is not able to be perfect.
As alternative, if you are working in Excel, you can create a native Excel pivot and use Excel formatting features to reach your goal.
Best Regards,
Ruggero
---------------------------------------------
When applicable please mark the appropriate replies as CORRECT https://community.qlik.com/docs/DOC-14806. This will help community members and Qlik Employees know which discussions have already been addressed and have a possible known solution. Please mark threads as HELPFUL if the provided solution is helpful to the problem, but does not necessarily solve the indicated problem. You can mark multiple threads as HELPFUL if you feel additional info is useful to others.
Best Regards,
Ruggero
---------------------------------------------
When applicable please mark the appropriate replies as CORRECT. This will help community members and Qlik Employees know which discussions have already been addressed and have a possible known solution. Please mark threads with a LIKE if the provided solution is helpful to the problem, but does not necessarily solve the indicated problem. You can mark multiple threads with LIKEs if you feel additional info is useful to others.
- Mark as New
- Bookmark
- Subscribe
- Mute
- Subscribe to RSS Feed
- Permalink
- Report Inappropriate Content
Hi Ruggero,
Thank you for your reply. I tried to use excel template and create a pivot table. Wondering if I can convert the table to straight table in Qlikview and add it to the Tables node on Nprinting end and use the expressions from the table? Or do I have to create formulas in Nprinting for each of those expressions?
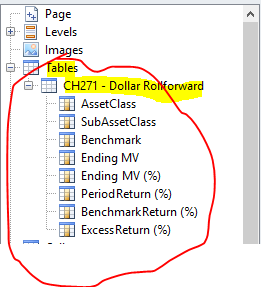
When i dragged and dropped the expressions and previewed the report I dint get any values under them except for headers.
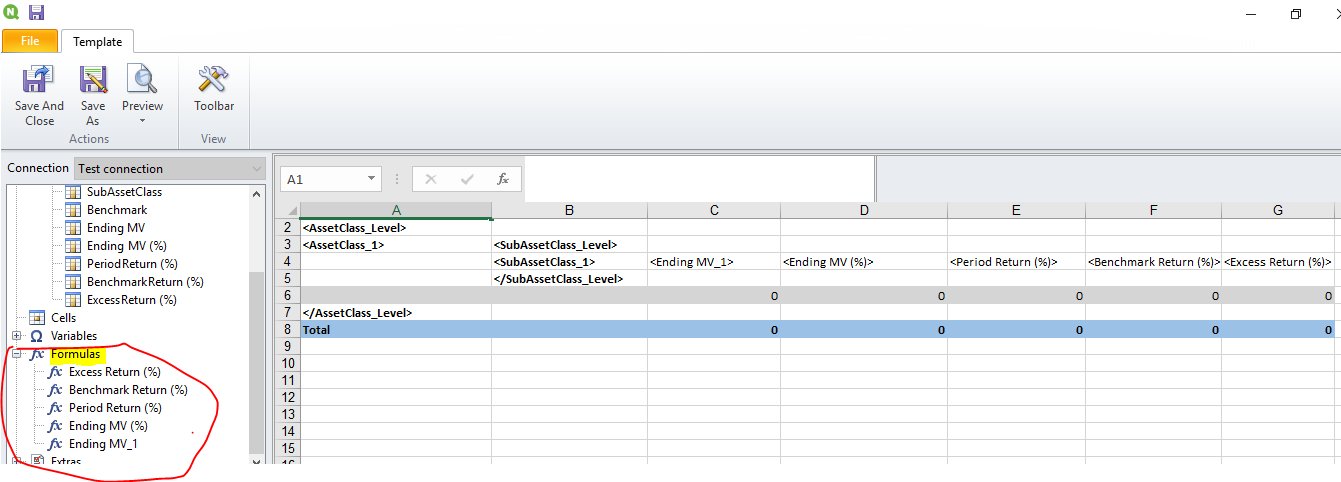
So i added formulas instead and used them to create the pivot table from scratch as shown below. Is their a better way to do?
- Mark as New
- Bookmark
- Subscribe
- Mute
- Subscribe to RSS Feed
- Permalink
- Report Inappropriate Content
Hi Swetha,
I would go with your first approach: create a straight table in QlikView and use that in an NPrinting Excel report to build your Pivot Table. Since you are using version 16 you can take a look at:
Tutorial: How to Create a Pivot Table Report with QlikView Data
Example:Create Pivot Table in Nprinting.
For NPrinting 17/18:
HTH - Daniel.
- Mark as New
- Bookmark
- Subscribe
- Mute
- Subscribe to RSS Feed
- Permalink
- Report Inappropriate Content
Hi Daniel,
Do you know if the formulas carry over to Nprinting from Qlikview as my expressions are pretty complex and involves functions like AGGR, TOTAL etc for calculating percentages. Do you think it would be feasible to generate those formulas in Nprinting pivot table?
- Mark as New
- Bookmark
- Subscribe
- Mute
- Subscribe to RSS Feed
- Permalink
- Report Inappropriate Content
Hi,
If you want to add formulas I think you must use Levels as explained in:
Note that using Levels is quite slower than using tables.
If you use formulas remember that each formula must return a single value. For example AGGR could return an array which is not supported in Qlilk NPrinting.
Best Regards,
Ruggero
---------------------------------------------
When applicable please mark the appropriate replies as CORRECT https://community.qlik.com/docs/DOC-14806. This will help community members and Qlik Employees know which discussions have already been addressed and have a possible known solution. Please mark threads as HELPFUL if the provided solution is helpful to the problem, but does not necessarily solve the indicated problem. You can mark multiple threads as HELPFUL if you feel additional info is useful to others.
Best Regards,
Ruggero
---------------------------------------------
When applicable please mark the appropriate replies as CORRECT. This will help community members and Qlik Employees know which discussions have already been addressed and have a possible known solution. Please mark threads with a LIKE if the provided solution is helpful to the problem, but does not necessarily solve the indicated problem. You can mark multiple threads with LIKEs if you feel additional info is useful to others.
- Mark as New
- Bookmark
- Subscribe
- Mute
- Subscribe to RSS Feed
- Permalink
- Report Inappropriate Content
Hi Ruggero,
Thank you for your response. I tried using levels and implemented the formulas in Nprinting, however my calculations dont seem to be align with Qlikview cals. The numbers are all off.
The actual output i should be getting is like below, the highlighted numbers are the correct values, however what i get from Nprinting formulas is different (Screen shot2), only first expression Ending MV returns correct values, rest are all incorrect. Those expressions use TOTAL function and that doesnt seem to work in Nprinting. Any work around?
Screenshot 2:
- Mark as New
- Bookmark
- Subscribe
- Mute
- Subscribe to RSS Feed
- Permalink
- Report Inappropriate Content
Hi,
I think the problem is that each value of a level is like to filter the source document to keep only that value. The formula is calculated with that filters but the value you want is without filters.
I need to investigate if there is a solution, maybe by using Excel formulas.
Best Regards,
Ruggero
---------------------------------------------
When applicable please mark the appropriate replies as CORRECT https://community.qlik.com/docs/DOC-14806. This will help community members and Qlik Employees know which discussions have already been addressed and have a possible known solution. Please mark threads as HELPFUL if the provided solution is helpful to the problem, but does not necessarily solve the indicated problem. You can mark multiple threads as HELPFUL if you feel additional info is useful to others.
Best Regards,
Ruggero
---------------------------------------------
When applicable please mark the appropriate replies as CORRECT. This will help community members and Qlik Employees know which discussions have already been addressed and have a possible known solution. Please mark threads with a LIKE if the provided solution is helpful to the problem, but does not necessarily solve the indicated problem. You can mark multiple threads with LIKEs if you feel additional info is useful to others.
- Mark as New
- Bookmark
- Subscribe
- Mute
- Subscribe to RSS Feed
- Permalink
- Report Inappropriate Content
Hi Ruggero,
Wondering if Nprinting 17 has a better way to bring pivot tables from qlikview dashboards instead of rebuilding them in Nprinting? Do you think the pivot table issue is only with Nprinting 16? Should an upgrade to newer version fix issues with pivot tables, by this I mean can we bring them like tables directly and it would come exactly as it is in QV without converting it to straight table or lose formatting