Unlock a world of possibilities! Login now and discover the exclusive benefits awaiting you.

- Qlik Community
- :
- All Forums
- :
- Qlik NPrinting
- :
- Re: Pivot Table in NPrinting 16
- Subscribe to RSS Feed
- Mark Topic as New
- Mark Topic as Read
- Float this Topic for Current User
- Bookmark
- Subscribe
- Mute
- Printer Friendly Page

 renuka_sasikuma
- Mark as New
- Bookmark
- Subscribe
- Mute
- Subscribe to RSS Feed
- Permalink
- Report Inappropriate Content
Pivot Table in NPrinting 16
Hi,
I have a Pivot table in QlikView and want to export same in N-Printing.
How do I go about it, because when exporting Pivot Table from QlikView to N-Printing it's getting converted into Straight Table.
I want the below exact table in N-Printing Excel Report Distribution.
| Group | Branch |
| Group1 | ABXC |
| XYZ | |
| Abhs | |
| hzxvch | |
| bhzb |
Can anyone pls help me.
Regards,
Renuka S
- Tags:
- qliksense
renuka_sasikuma- Mark as New
- Bookmark
- Subscribe
- Mute
- Subscribe to RSS Feed
- Permalink
- Report Inappropriate Content
Hi Lech,
Thanks for your reply.
The result is in NPrinting.
Kindly find the below info.
1.
vDisb1='Q'&vMaxQtr &' Target per Month'
Where vMaxQtr=MAX(IF([FIN YEAR]=vMaxYear,Fin_Qtr_No))
wherevMaxYear=MAX([FIN YEAR])
2.label expression in qlik.
='Q'&vMaxQtr &' Target per Month'
3. result in qlik.

Regards,
Renuka S

 Lech_Miszkiewic
- Mark as New
- Bookmark
- Subscribe
- Mute
- Subscribe to RSS Feed
- Permalink
- Report Inappropriate Content
i see
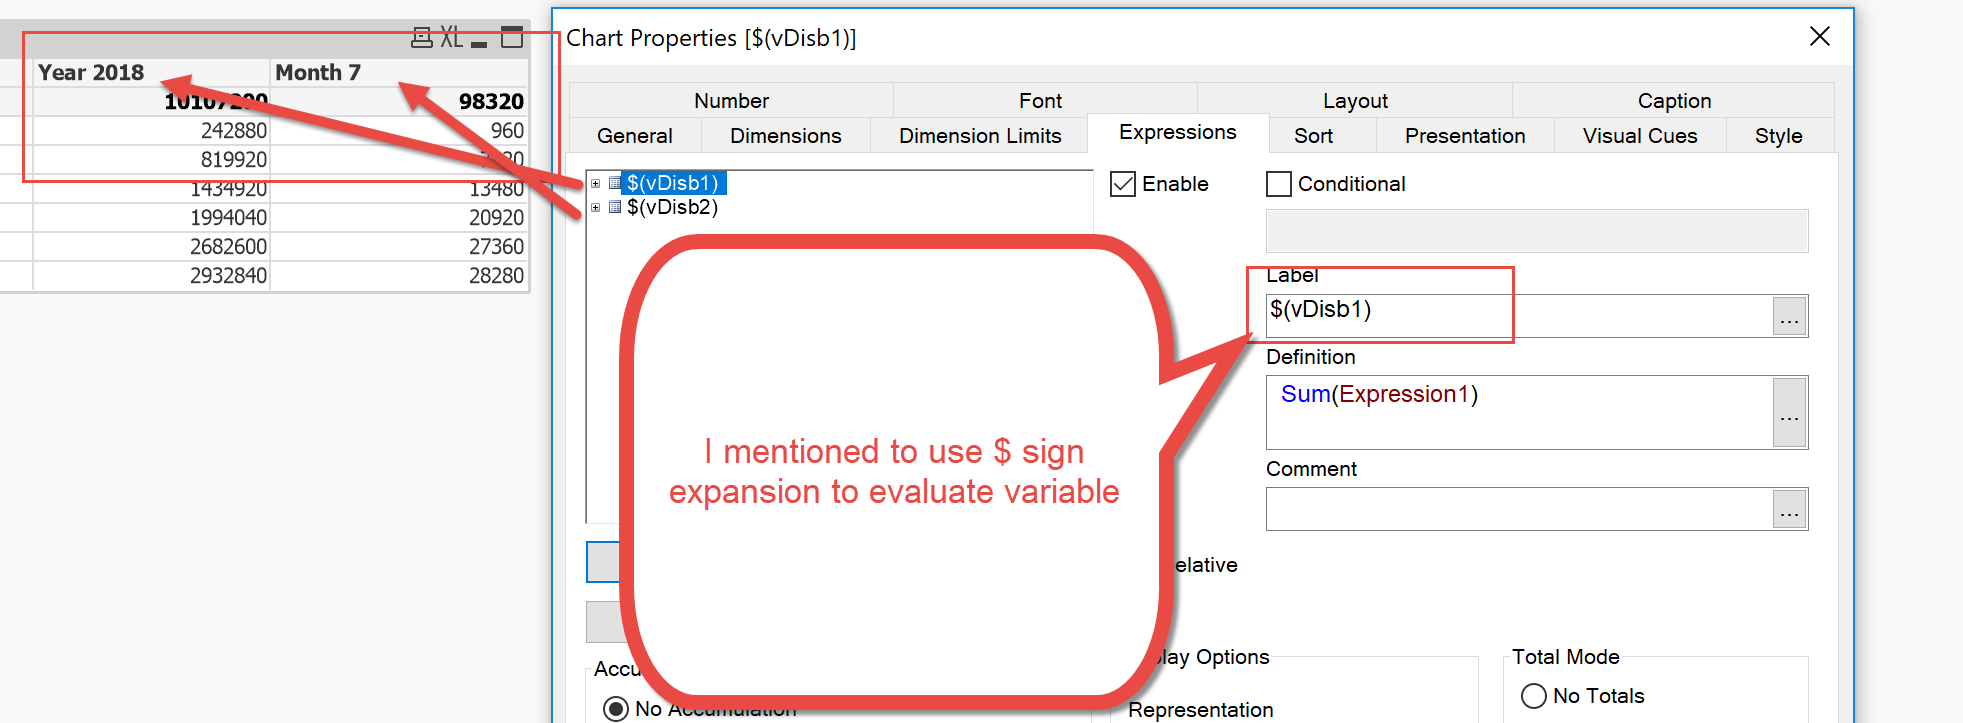
so like i said before you would have to use "=" sign in variable definition to evaluate it prior to bringin it to NPrinitng.
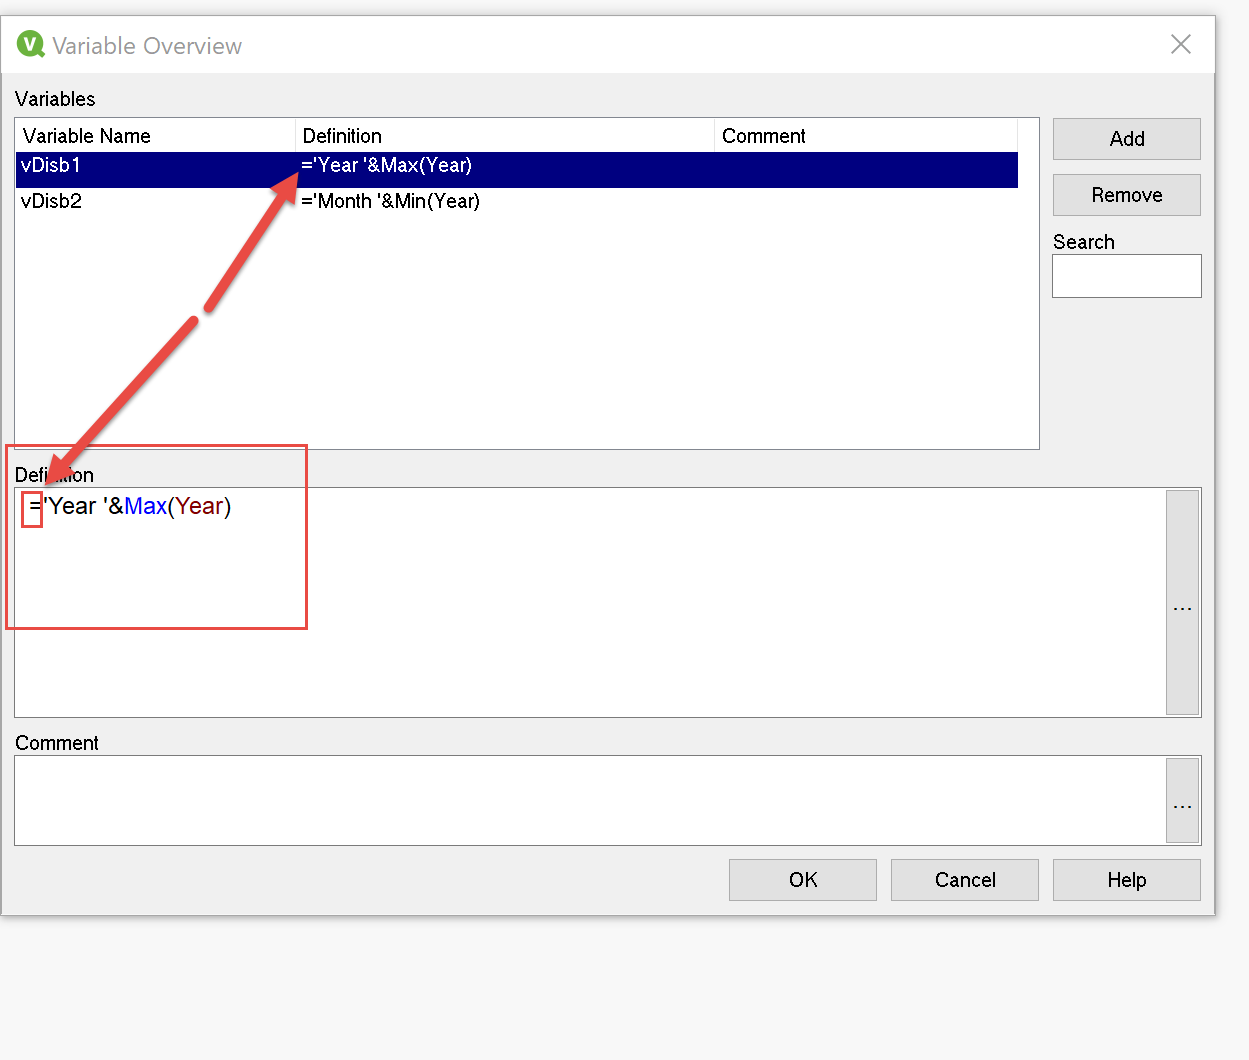
Open your app, go to Ctr+alt+V (or variable editor) and edit your variable by putting "=" sign in it so your variable would be:
vDisb1: ='Q'&vMaxQtr &' Target per Month'
If you do not want to re-factor your Qlik App you can create this label directly in NPrinitng by creating function in template where template formula would be simply:
='Q'&vMaxQtr &' Target per Month'
You could then use formula tag instead of column label coming directly from Qlik
more details here:
https://help.qlik.com/en-US/nprinting/June2018/Content/ExcelReports/Formulas.htm
cheers
Lech
renuka_sasikuma- Mark as New
- Bookmark
- Subscribe
- Mute
- Subscribe to RSS Feed
- Permalink
- Report Inappropriate Content
Hi Lech,
I tried the same, but my data itself is not coming in Straight table. So I did some changes in QVW, I created that label as Variable. (vDisb1,vDisb2).
So in NPrinting I am taking as Chart Level. I can view the Data.

My output in the above template.

So after this when I do Insert-Table and the Design Summarize with Pivot Table, No data appears.

Can you help in this where I am missing if any point.
Thanks in Advance.
Lech_Miszkiewic- Mark as New
- Bookmark
- Subscribe
- Mute
- Subscribe to RSS Feed
- Permalink
- Report Inappropriate Content
few questions:
Why are you using level here? It will hit the performance a lot!!!
Second - why are you not using built-in excel Table?
did you try to follow steps i have provided isn some other posts?
renuka_sasikuma- Mark as New
- Bookmark
- Subscribe
- Mute
- Subscribe to RSS Feed
- Permalink
- Report Inappropriate Content
Level because as suggested (Reporting) and if I create Pivot table there is a chance of editing the output by un-hiding the sheet.
Second- Yes I tried the steps which mentioned in other post also with few more ways.
Output for the mentioned link-

But my main problem is the Dynamic label of the Report which is used as Variable.
Even if I do the same in Excel Pivot - same problem.
Regards,
Renuka
Lech_Miszkiewic- Mark as New
- Bookmark
- Subscribe
- Mute
- Subscribe to RSS Feed
- Permalink
- Report Inappropriate Content
I did little demo with screenshots as i do not know how else i can help you.
Note, If you will use dynamic column labels and would try to use Excel Pivot table your solution will not work as Microsoft Excel will not recognize new columns as those which will need to be added to Pivot View.
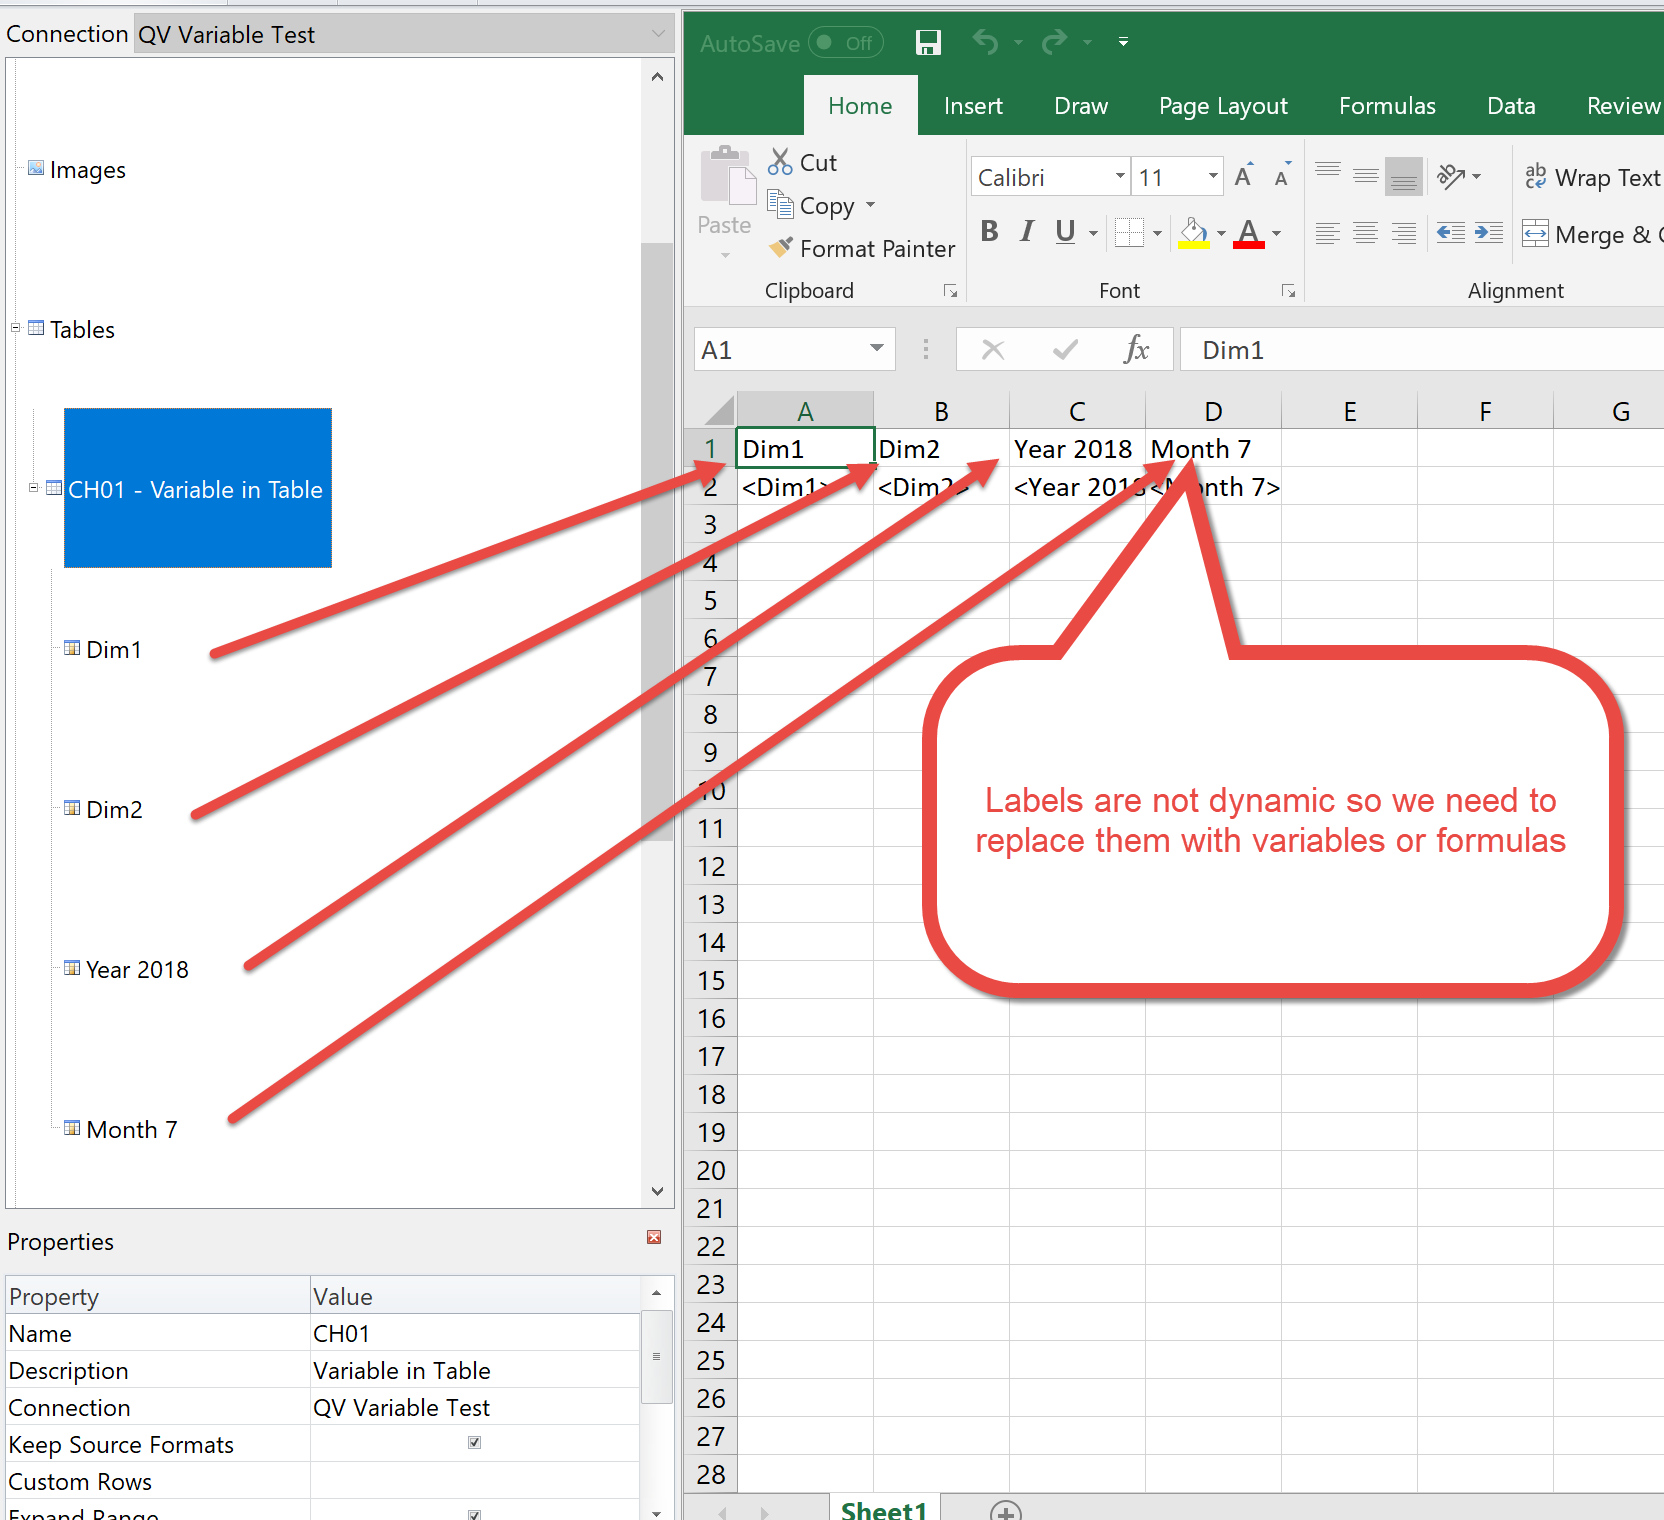
Below are steps on how to achieve dynamic labels in XLS template with NPrinitng.
cheers
Lech
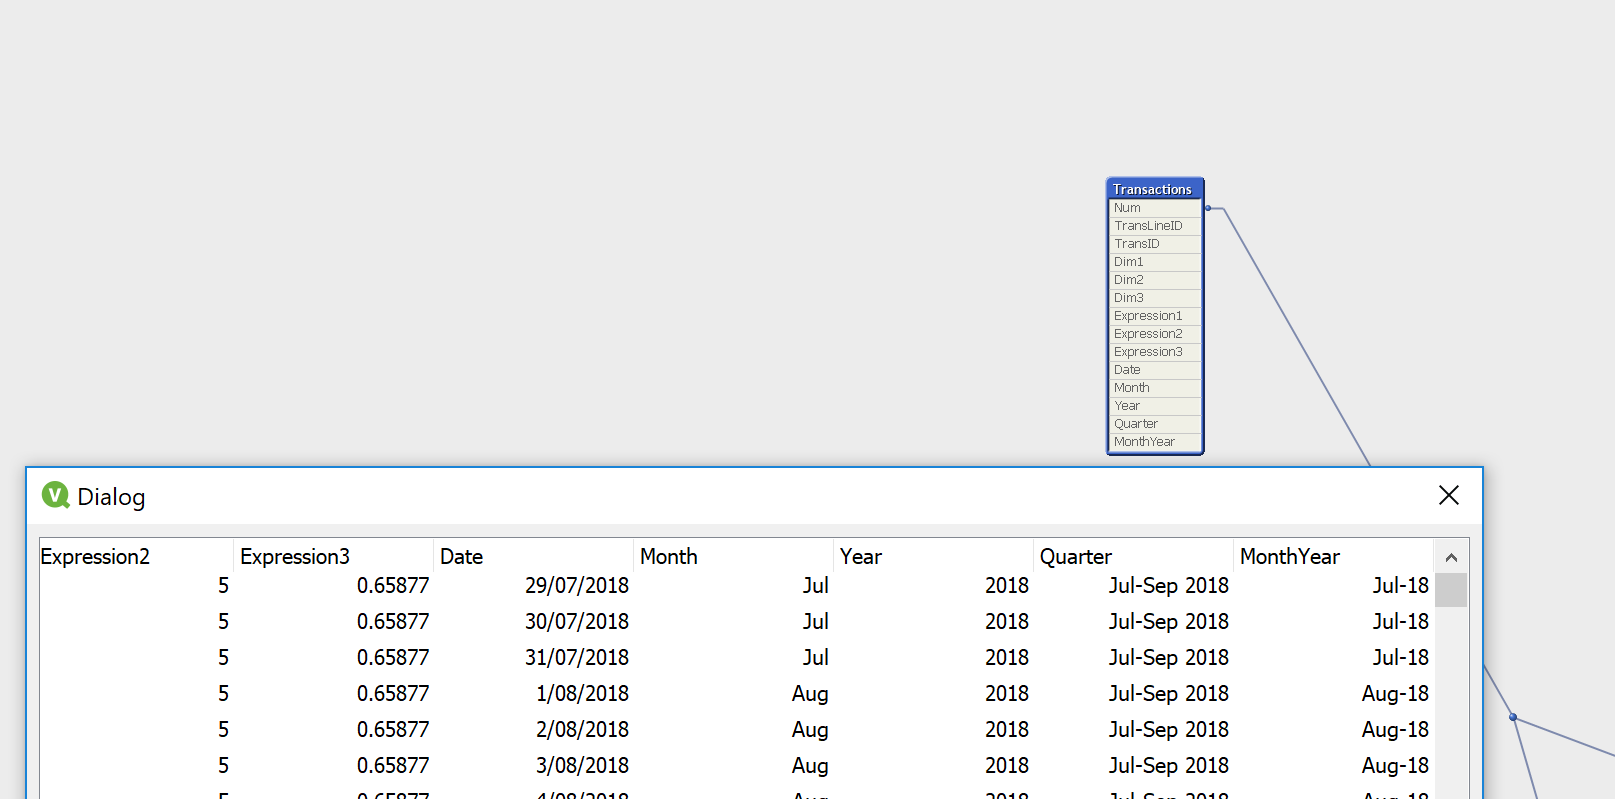
My Data model in Qlik
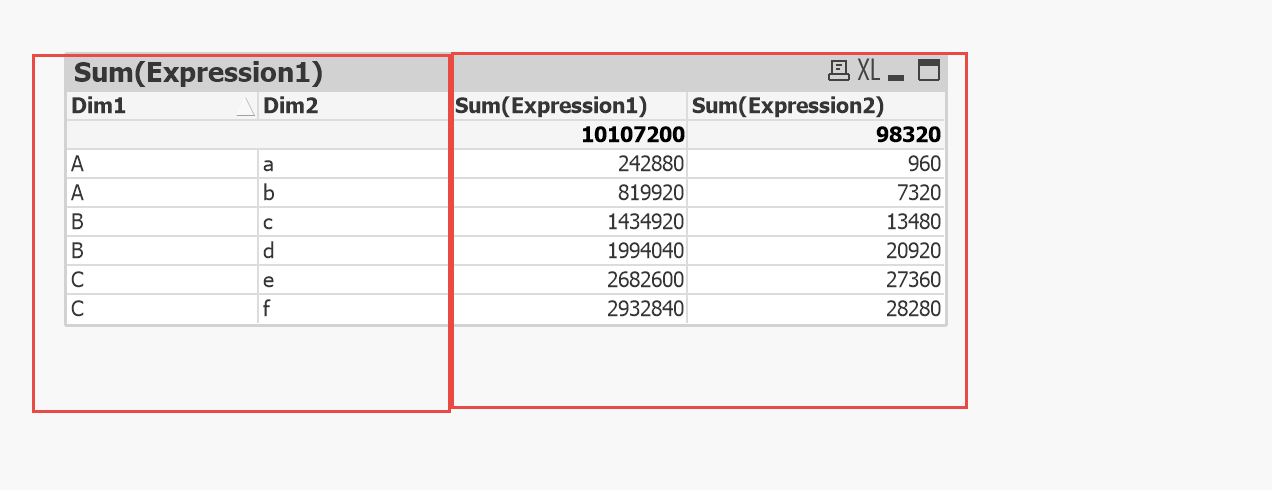
My Front end Chart/Table
My variable definitions
My evaluation via $sign expansion
Building NPrinitng Template
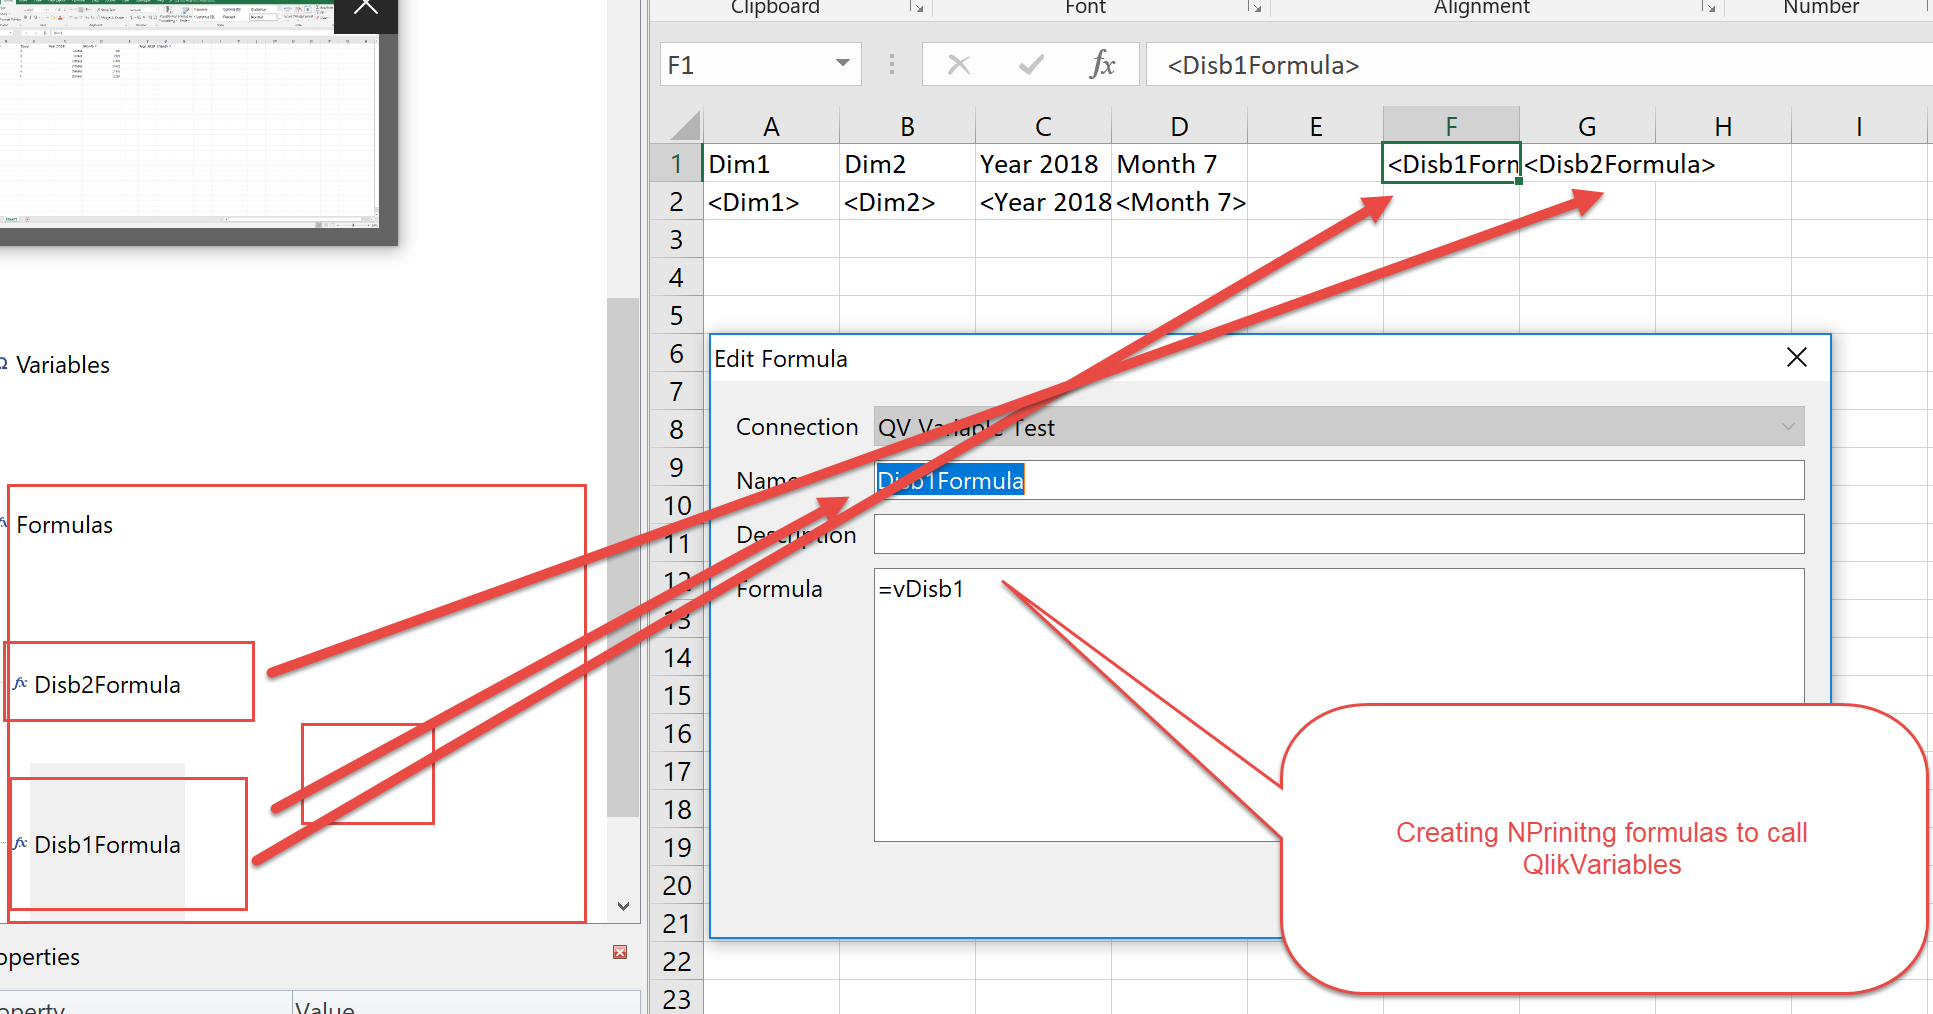
OPTION 1 - Using NPrinting formulas!!! (i use formula to call variable created in Qlik. Here you can also directly put any formula which will return value (just like textbox in Qlik)
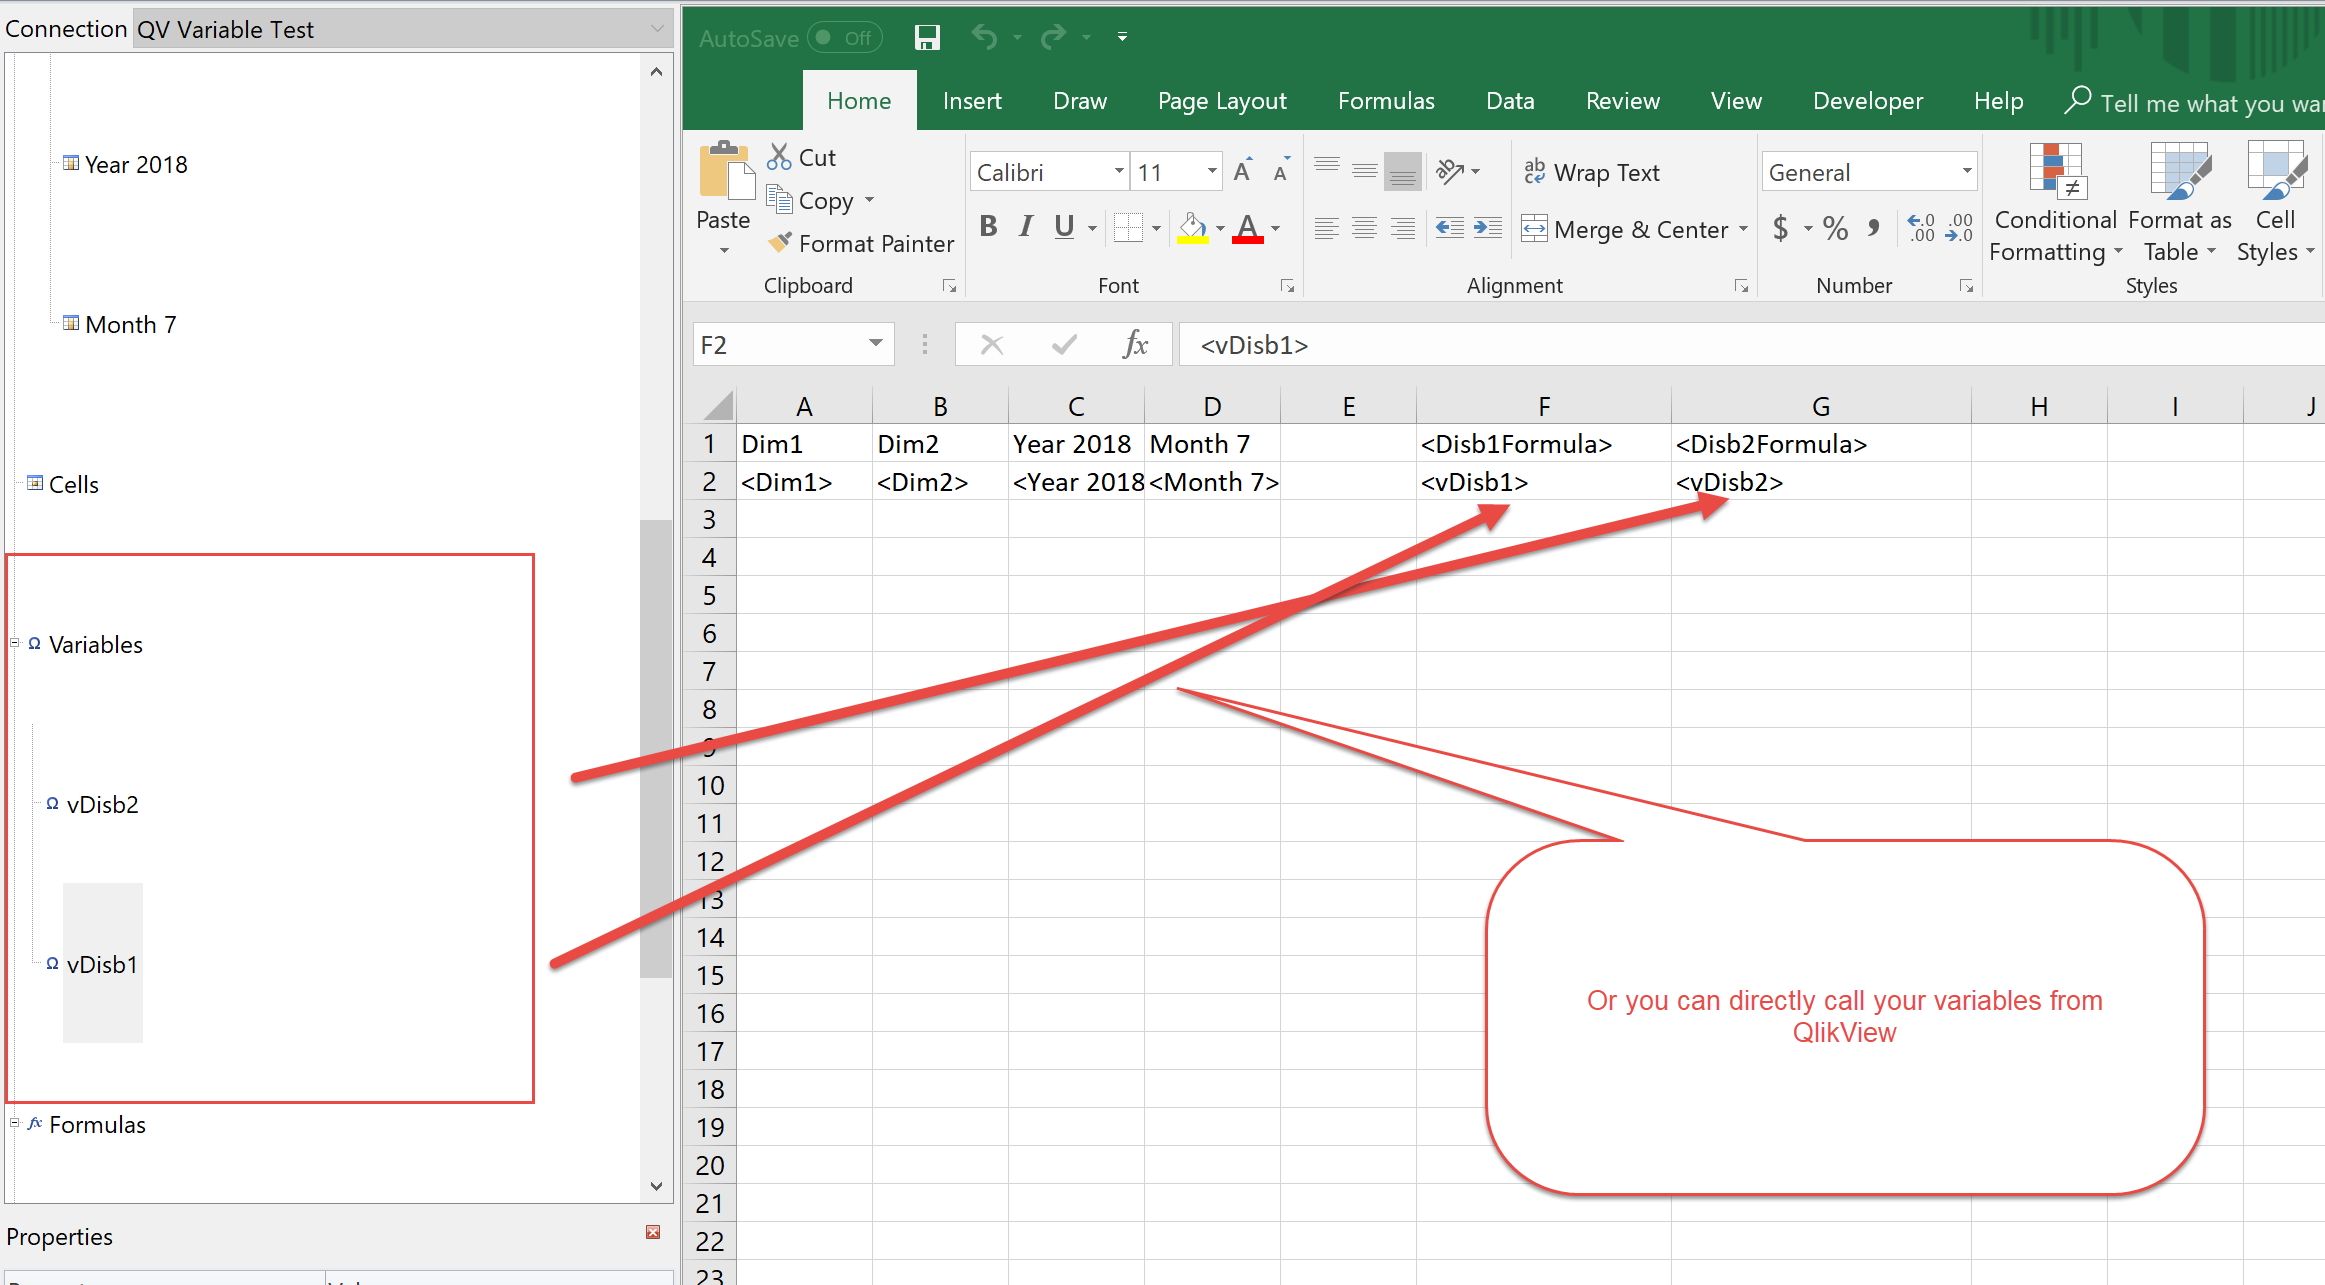
OPTION 2 - direct use of variables (depending on variables you use you might need to choose between option 1 or 2)
Preview - labels are working as expected (columns f & G)
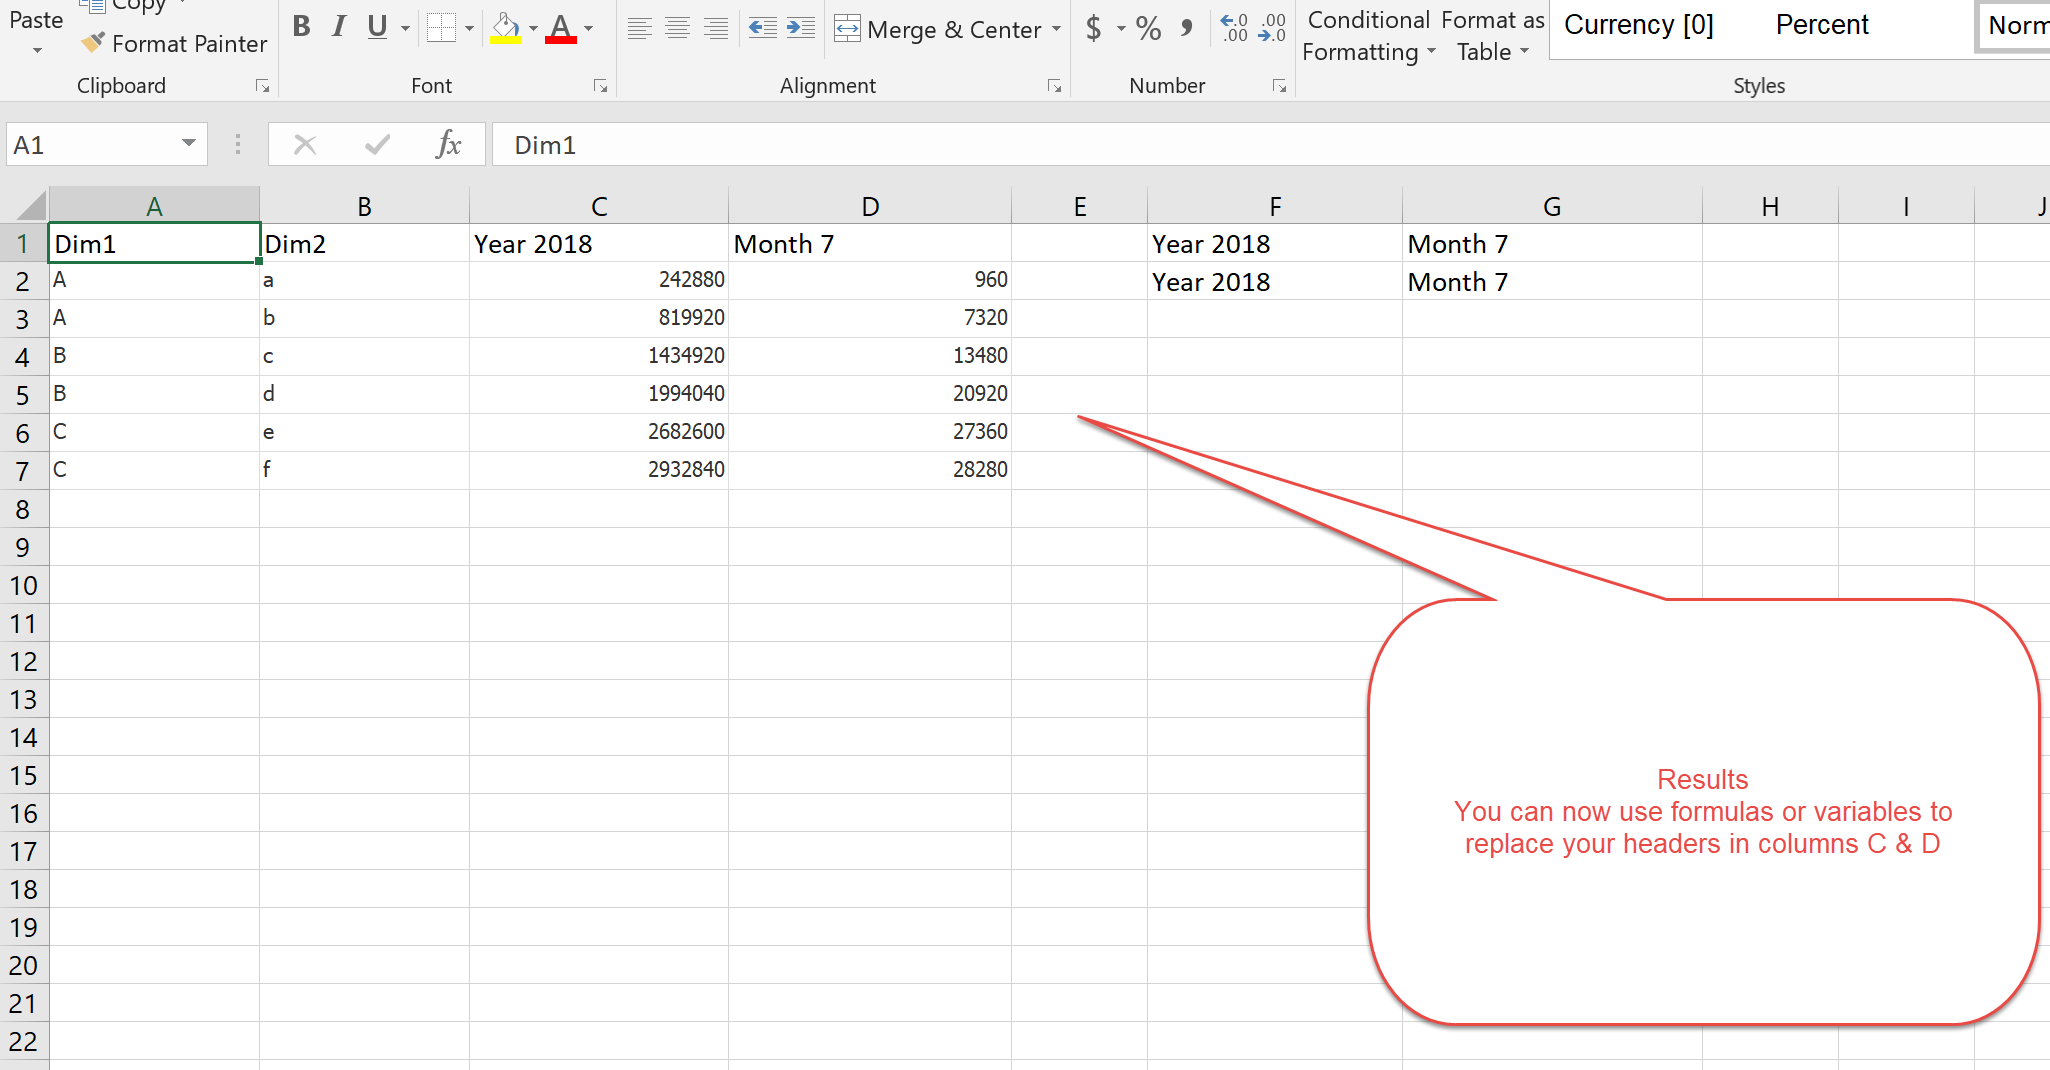
Now Lets replace static column names with dynamic tags
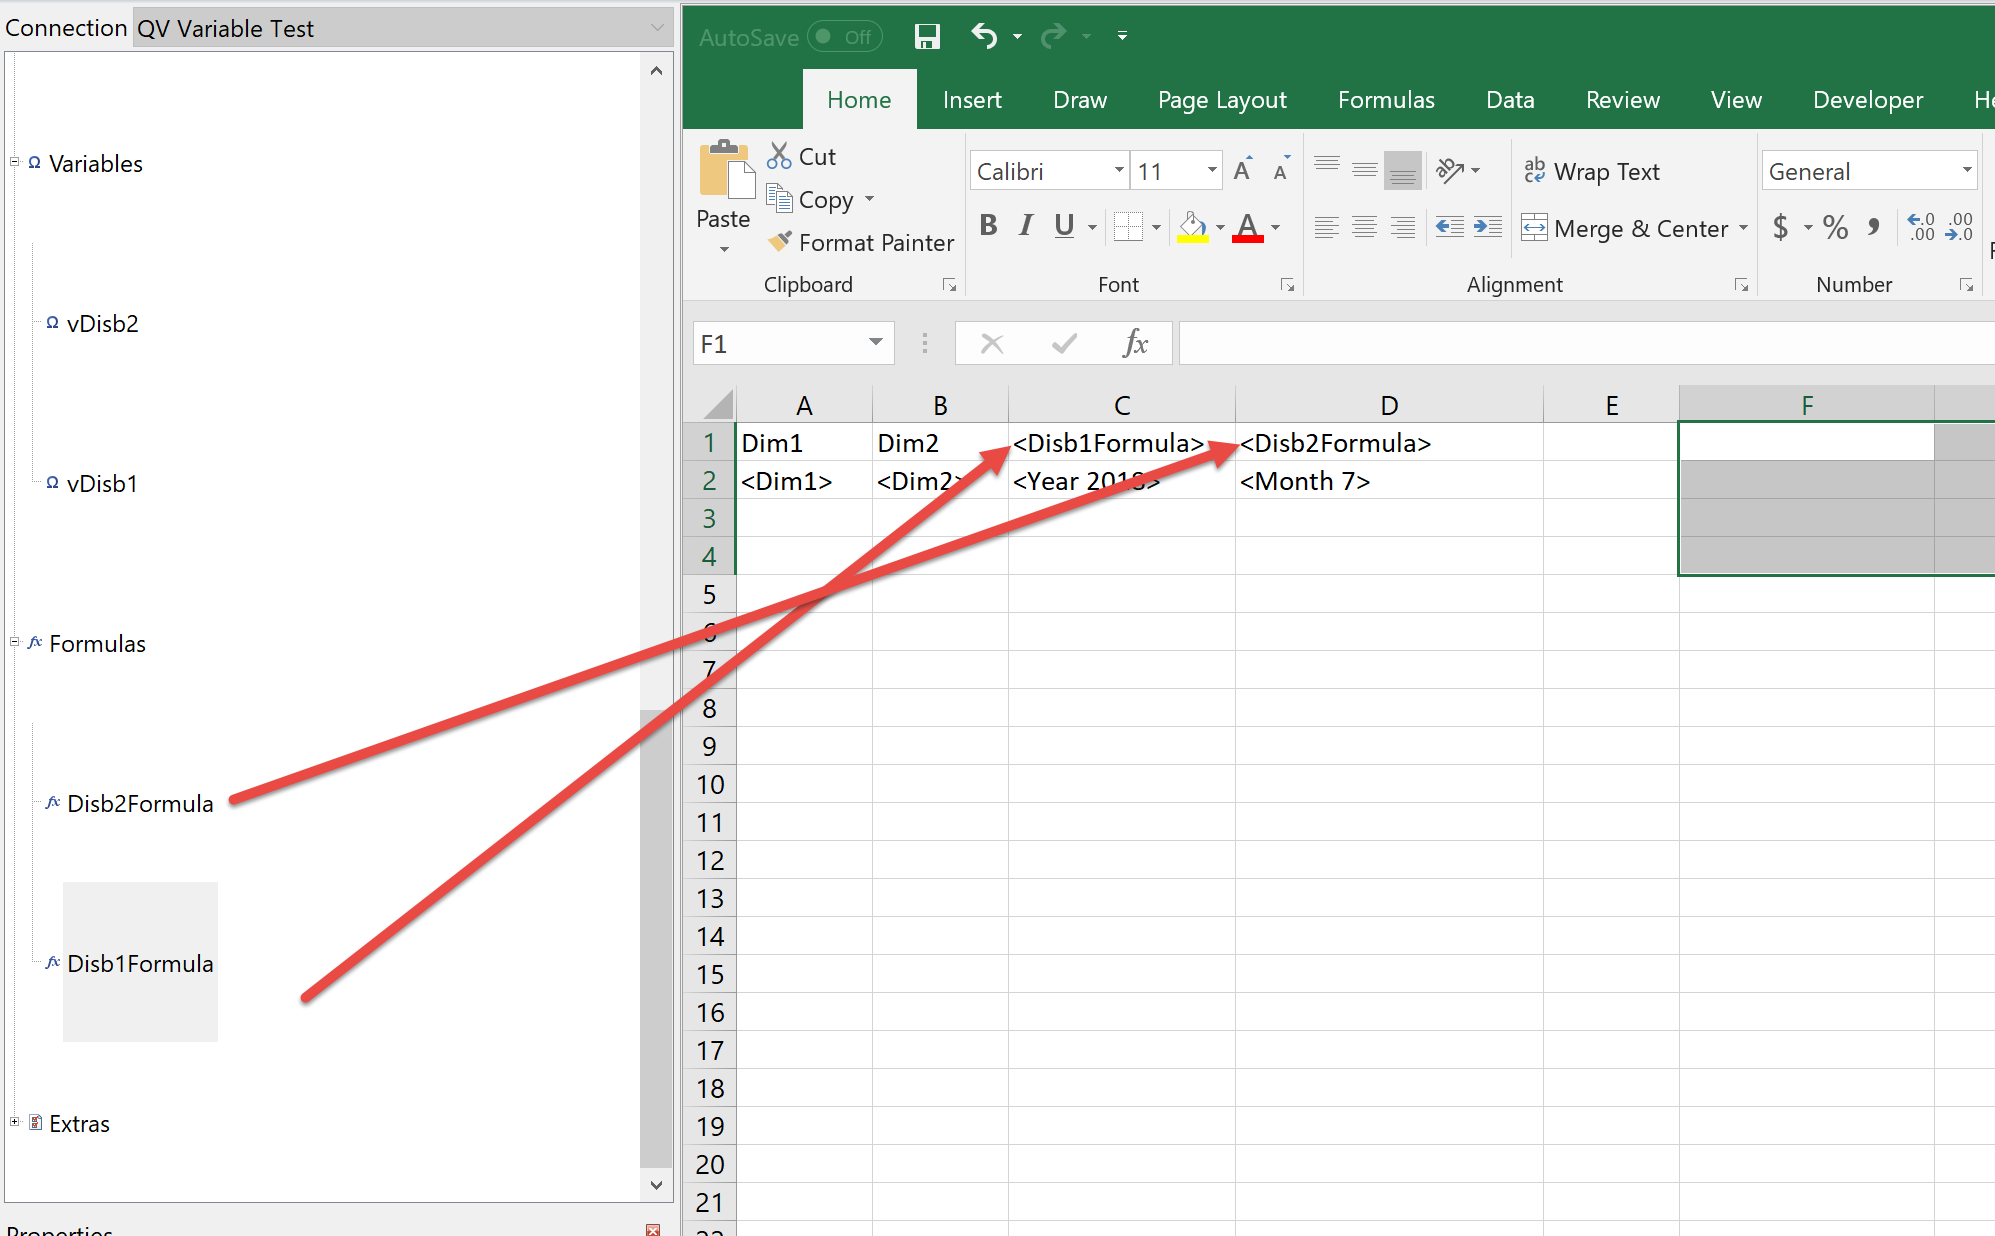
Creating Excel Table
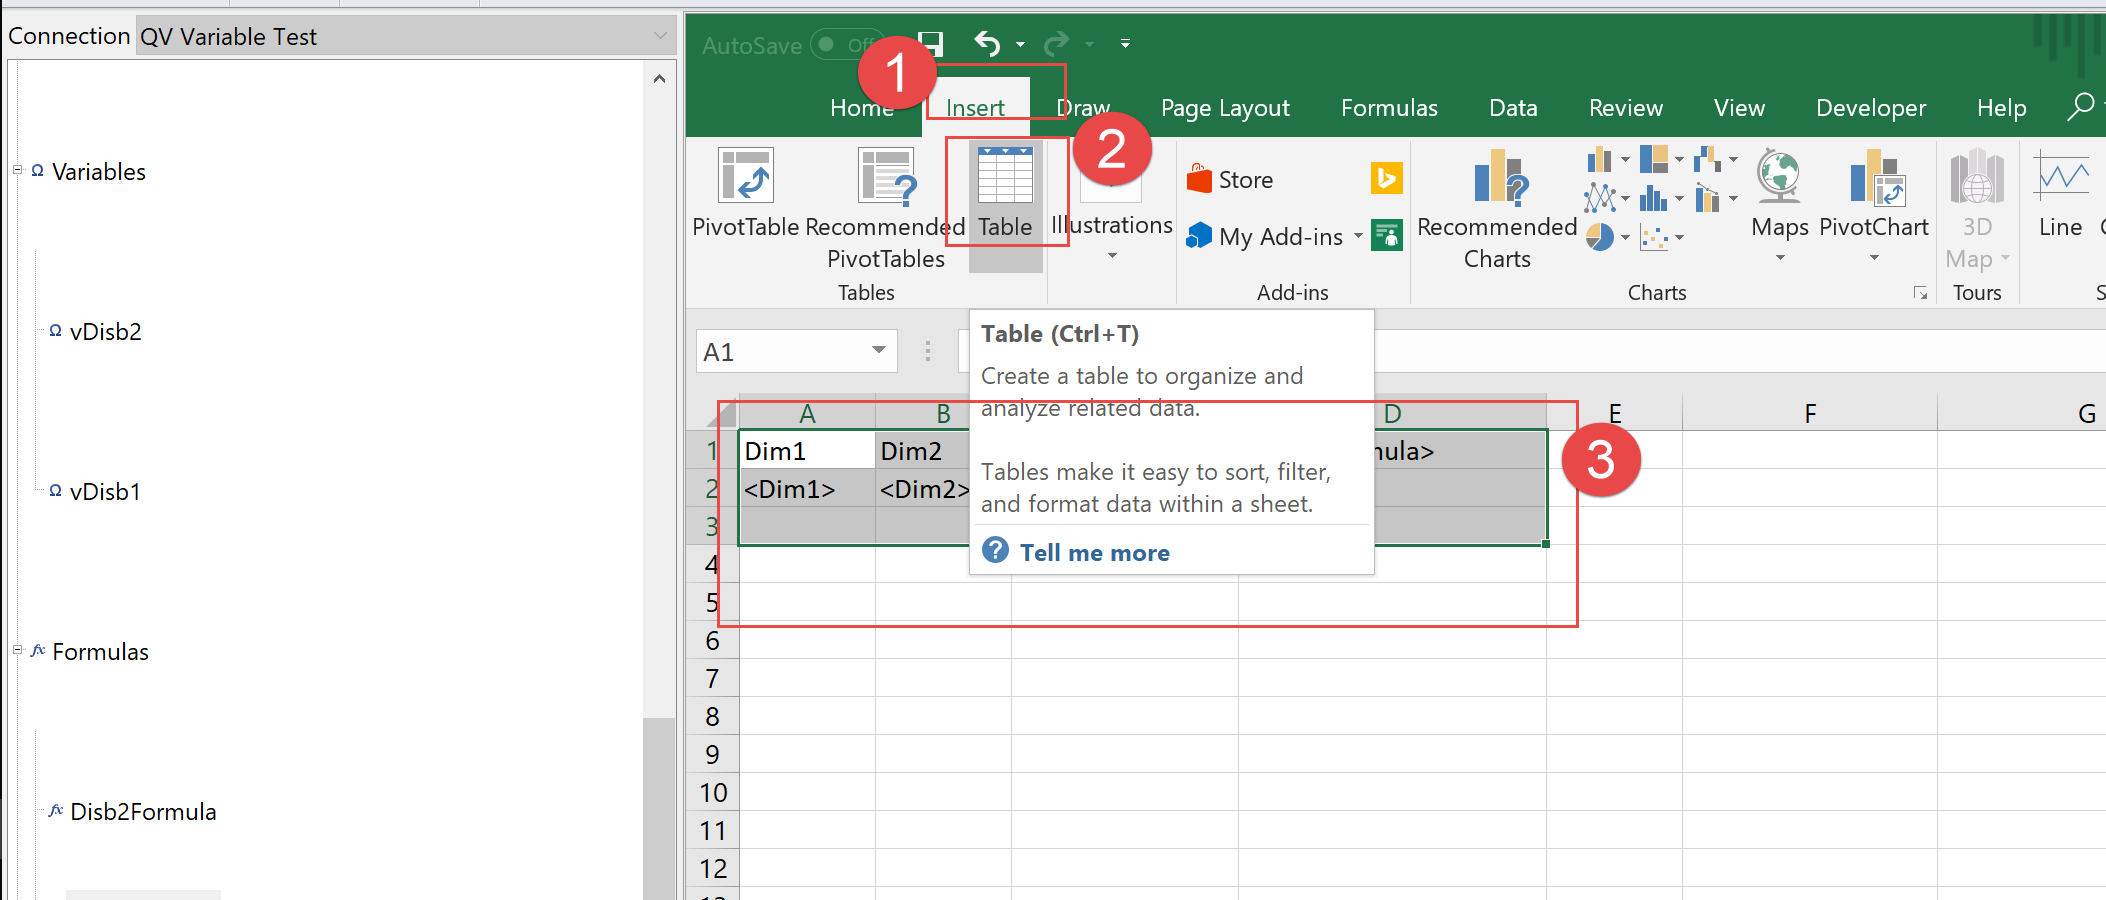
removing last row
Result as expected
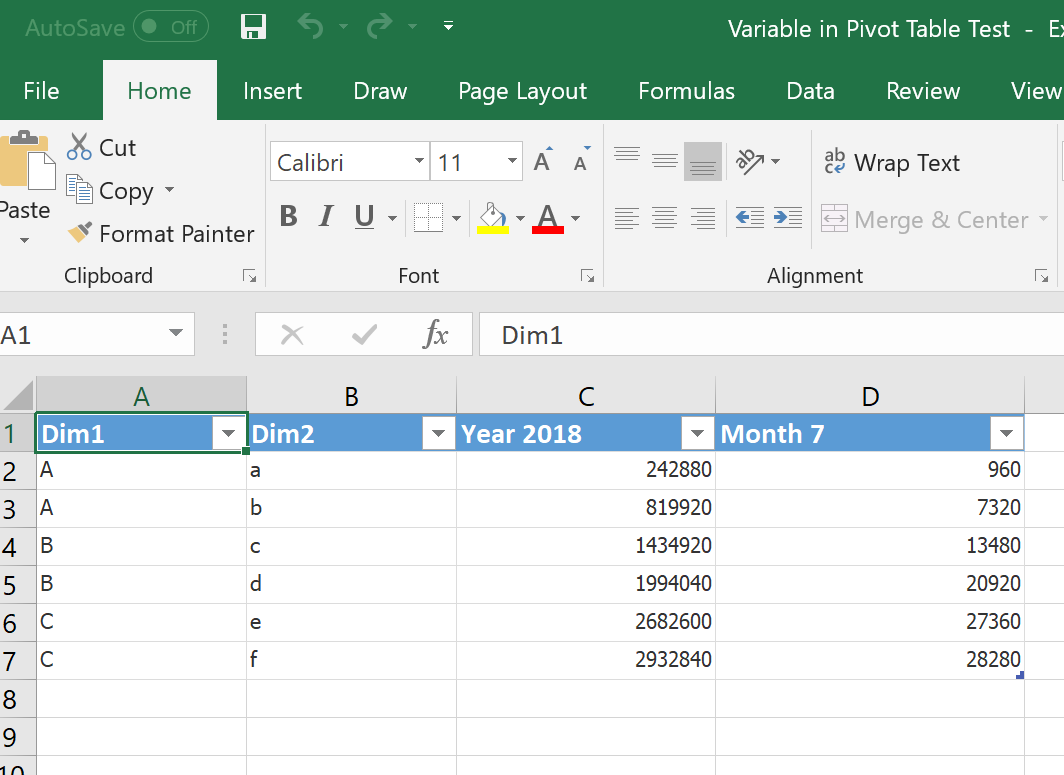
renuka_sasikuma- Mark as New
- Bookmark
- Subscribe
- Mute
- Subscribe to RSS Feed
- Permalink
- Report Inappropriate Content
Hi Lech,
Thank You for the demo in simple way.
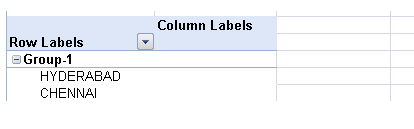
Hope you got my query, if you see in my last and last second reply I have mentioned that my Dynamic variable is working till Straight Table but after when I convert into Pivot then there is a problem, i.e.:- Design Summarize with Pivot Table after all the step as mentioned by you.
Regards,
Renuka S
Lech_Miszkiewic- Mark as New
- Bookmark
- Subscribe
- Mute
- Subscribe to RSS Feed
- Permalink
- Report Inappropriate Content
so as mentioned before:
"
Note, If you will use dynamic column labels and would try to use Excel Pivot table your solution will not work as Microsoft Excel will not recognize new columns as those which will need to be added to Pivot View.
"
there is no solution for this in Excel and it is not NPrinitng limitation but MsExcel limitation!
Lech_Miszkiewic- Mark as New
- Bookmark
- Subscribe
- Mute
- Subscribe to RSS Feed
- Permalink
- Report Inappropriate Content
To add to my previous comment.
Before designing report in NPrinitng i would suggest to take into account following restrictions:
- When using Excel Pivot table as a final solution make sure that all fields used in your PIVOT Table structure will have static name.
- If you require dynamic names for some of the colums it maybe required to put them as values in a Qlik source table
- If the format of the output is similar maybe you could use straight table with dynamic columns to achieve the same what you are trying to achieve with Pivot table
- I would try to verify which parts of report are dynamic and affect report structure and which are just values flowing through as data changes with the time
if you could provide us with screenshots and steps you are trying to do to build your report maybe we could help you more. Your description though has to be very detailed including data model in qlik, screenshot of expressions and layout of object in qlik and then detailed screenshot of template.
If you dont want to use your own data maybe build a small Qlik app with dummy data, attach it here and provide an excel file with expected output, so we can start picking our brains on how to help you.
Your problem is a solution problem really and needs to be looked at with a particular data sample.
renuka_sasikuma- Mark as New
- Bookmark
- Subscribe
- Mute
- Subscribe to RSS Feed
- Permalink
- Report Inappropriate Content
Can you try this same for doing it in i.e.:- Design Summarize with Pivot Table.
Hope you get the result and we can check what difference in our steps.
Regards,
Renuka S
