Unlock a world of possibilities! Login now and discover the exclusive benefits awaiting you.
- Qlik Community
- :
- All Forums
- :
- Qlik NPrinting
- :
- Re: Vertical table in NPrinting from a chart table...
- Subscribe to RSS Feed
- Mark Topic as New
- Mark Topic as Read
- Float this Topic for Current User
- Bookmark
- Subscribe
- Mute
- Printer Friendly Page
- Mark as New
- Bookmark
- Subscribe
- Mute
- Subscribe to RSS Feed
- Permalink
- Report Inappropriate Content
Vertical table in NPrinting from a chart table with a vertical list of elements ?
Hi everyone,
Is there any way to get a vertical table in NPrinting (to have Excel output) from a chart table with a vertical list of elements ?
One way I found is to create levels that would select each element I need in the chart. However, this technique is very slow and I suspect that another way should exist...
When I try to get the chart table with all elements (vertical list), NPrinting considers it as a horizontal table and would dispay it as such ...
Thanks in advance for your help.
- Mark as New
- Bookmark
- Subscribe
- Mute
- Subscribe to RSS Feed
- Permalink
- Report Inappropriate Content
Hi,
can you post xls with example?
Thanks,
Matus
- Mark as New
- Bookmark
- Subscribe
- Mute
- Subscribe to RSS Feed
- Permalink
- Report Inappropriate Content
Did you mean vertical or horizontal? vertical is not an issue as it is by default vertical.
I you actualy wanted to do your table horisontaly what if you use pivot table instead of straight table?
I usually create separate objects in my qlik application just for NPrinting use. ican then customize those object as much as i want.
Pivot table use would be soulution. Obviously then you cannot really control number of columns created in the table so in Nprinting template you will only have CHXX Id for chart ID without columns beeing indicated
hope this helps
kind regards
Lech
- Mark as New
- Bookmark
- Subscribe
- Mute
- Subscribe to RSS Feed
- Permalink
- Report Inappropriate Content
Are you looking to create Pivot representation in NPrinting ??
- Mark as New
- Bookmark
- Subscribe
- Mute
- Subscribe to RSS Feed
- Permalink
- Report Inappropriate Content
Thank you for your answer. I am looking for a vertical table. Indeed, when I import a vertical chart (whether it is a pivot or a straight table), I get a horizontal table in NPrinting. I would like to have a vertical table n NPrinting and not a horizontal one ....
How do you get a vertical table as default ?
Best regards,
Laurent.
- Mark as New
- Bookmark
- Subscribe
- Mute
- Subscribe to RSS Feed
- Permalink
- Report Inappropriate Content
Hi Laurent,
Could you please attach few screenshots?
- Table/Chart in Qlikview,
- Your nPrinting templated when editing it (especialy with objects used to build table) extended so i can see them
- Your NPrinting result (generated report)
Behaviour you have described is not normal. I would like to reproduce your issue.
looking forward to hear from you.
Lech
- Mark as New
- Bookmark
- Subscribe
- Mute
- Subscribe to RSS Feed
- Permalink
- Report Inappropriate Content
Hello lech_miszkiewicz,
Here you go,
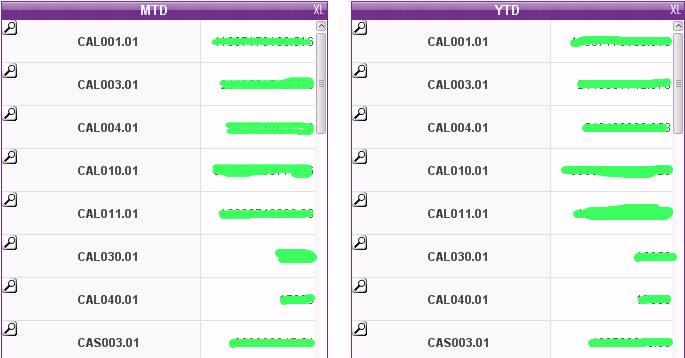
Here are the two chart table I have in my QV.
I have named these tables QV_VAL_MTD and QV_VAL_YTD.
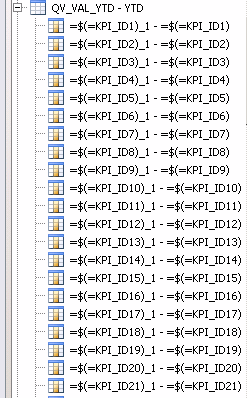
In NPrinting, I imported those two tables 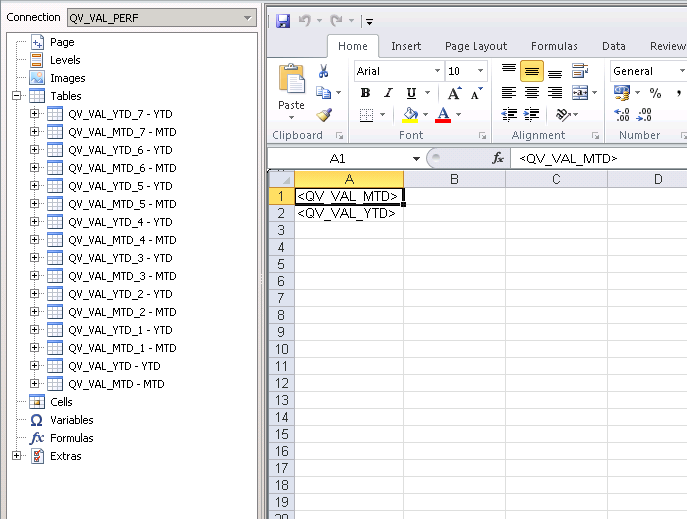
And here is the view where the object is extended:
When The excel file is generated, I get this as an output :
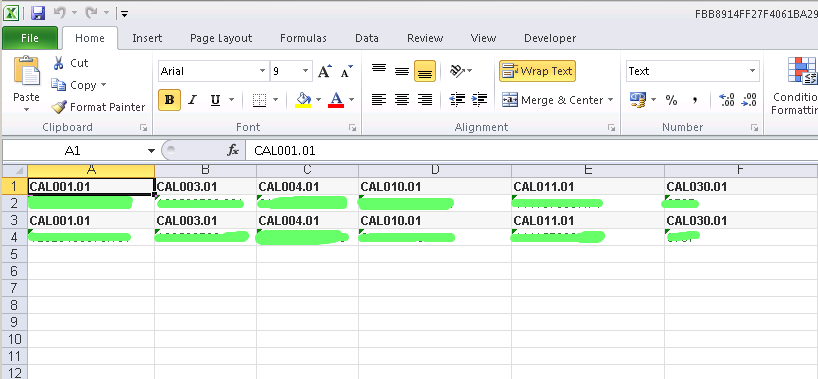
What I would like is a table in Excel as it is in the QV, a vertical table ...
I hope this helps you to understand my problem and one more time, Thanks for your interests.
Best regards,
LL.
PS: Sorry that I had to blur the data
- Mark as New
- Bookmark
- Subscribe
- Mute
- Subscribe to RSS Feed
- Permalink
- Report Inappropriate Content
Ok, now i understand.
here is the think - in qlikview your tables are actualy using horizontal checkbox to be shown like on your screenshots.
So those tables are not naturaly vertical, but by default they are horizontal - they look vertical because if you look at Properties-->Presentation of each of this charts (and screenshot it for me please as well just to confirm my teory) you will see that "horizontal" checkbox is selected.
In other words - you have horizontal table in QlikView which you then make look like vertical by applying horizontal checkbox. This trick will not work in NPrinting as it does not recognise that checkbox.
You would probably have to build your chart in different way in qlikview. I would have to look at what are you trying to show there to be able to help more. Your table is not typical metric cut by some dimensions. It looks like you have a bunch of expressions and no dimensions in it.
I am happy to assist with it if you can give me bit more information what this data meant to show and your datamodel
regards
Lech