Unlock a world of possibilities! Login now and discover the exclusive benefits awaiting you.
- Qlik Community
- :
- All Forums
- :
- Qlik NPrinting
- :
- nPrinting 17.5
- Subscribe to RSS Feed
- Mark Topic as New
- Mark Topic as Read
- Float this Topic for Current User
- Bookmark
- Subscribe
- Mute
- Printer Friendly Page
- Mark as New
- Bookmark
- Subscribe
- Mute
- Subscribe to RSS Feed
- Permalink
- Report Inappropriate Content
nPrinting 17.5
I am just making sure that I am doing this correct so if someone can tell me if I am doing this incorrectly.
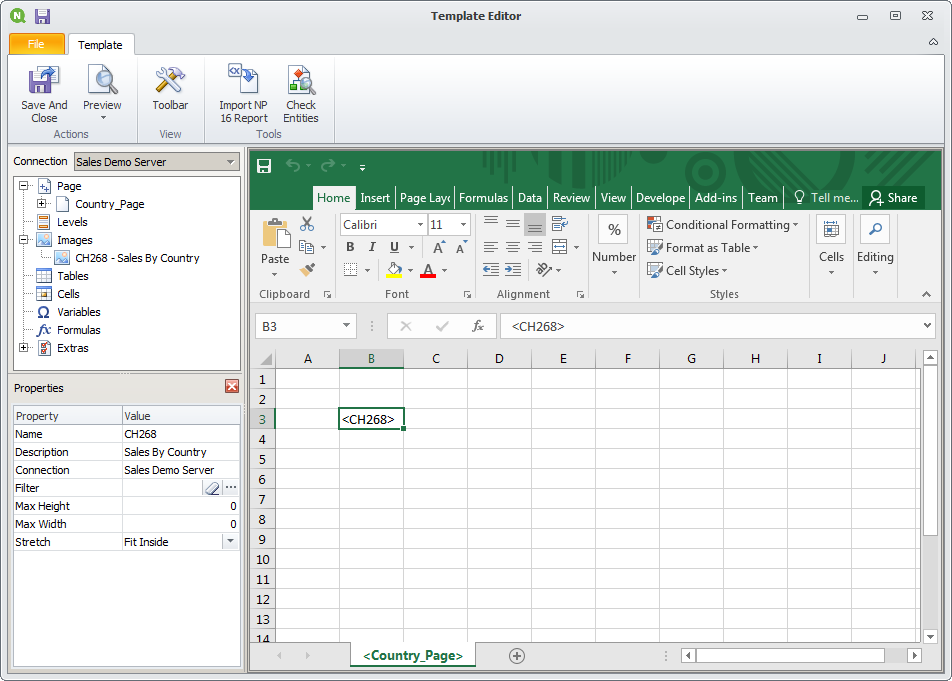
I have a template with one tab.
I am using nPrinting 17.5 and have a group of countries.
At the top of my nPrinting Designer, I right click on Page, select Country from my selection box and <Country_Page> appears in the tab.
I choose my Image <CH423> and it appears on my Excel
So when I run this, I should see one excel report, with a number of tabs which have a country name and in each tab sheet, I should see an bar chart with details applying to the country.
However, all I am seeing is the tab name of the country and the same overall graph in the tabsheet where this graph should apply to its country
This is fine in nPrinting 16.2 but the minute I run it in 17.5, it doesn't work
- Mark as New
- Bookmark
- Subscribe
- Mute
- Subscribe to RSS Feed
- Permalink
- Report Inappropriate Content
Hi,
This means that the Country field added in the Pages node comes from a different connection than the CH423 chart added in the Images node or that the chart is detached.
Pages works in Qlik NPrinting 17+ as it worked in 16.
Check also if in your 16 installation you are using linked fields to connect the same field in two or more connections. Linked Fields are not yet supported by Qlik NPrinting 17+.
Best Regards,
Ruggero
---------------------------------------------
When applicable please mark the appropriate replies as CORRECT https://community.qlik.com/docs/DOC-14806. This will help community members and Qlik Employees know which discussions have already been addressed and have a possible known solution. Please mark threads as HELPFUL if the provided solution is helpful to the problem, but does not necessarily solve the indicated problem. You can mark multiple threads as HELPFUL if you feel additional info is useful to others.
Best Regards,
Ruggero
---------------------------------------------
When applicable please mark the appropriate replies as CORRECT. This will help community members and Qlik Employees know which discussions have already been addressed and have a possible known solution. Please mark threads with a LIKE if the provided solution is helpful to the problem, but does not necessarily solve the indicated problem. You can mark multiple threads with LIKEs if you feel additional info is useful to others.
- Mark as New
- Bookmark
- Subscribe
- Mute
- Subscribe to RSS Feed
- Permalink
- Report Inappropriate Content
Hi Ruggero,
No, only using one connection. There is nothing complicated about it.
Its one connection. I've even redesigned the page and started from scratch.
The countries do populate in the tab name but they don't change within the graph to associate themselves with the country tab name. So what I am getting is say, 20 countries, all with the same graph. Not that it should make a difference but my graph has the following chart title so this changes to reflect the country
= if(GetSelectedCount(Country)>1 or GetSelectedCount(Country)=0,'All',Country) & ' Claims incl Off-system
- Mark as New
- Bookmark
- Subscribe
- Mute
- Subscribe to RSS Feed
- Permalink
- Report Inappropriate Content
Hi,
The Pages node is working;

Attached you can see the result. So there should be something in your chart or in your template. Could you share some screenshots?
Best Regards,
Ruggero
---------------------------------------------
When applicable please mark the appropriate replies as CORRECT https://community.qlik.com/docs/DOC-14806. This will help community members and Qlik Employees know which discussions have already been addressed and have a possible known solution. Please mark threads as HELPFUL if the provided solution is helpful to the problem, but does not necessarily solve the indicated problem. You can mark multiple threads as HELPFUL if you feel additional info is useful to others.
Best Regards,
Ruggero
---------------------------------------------
When applicable please mark the appropriate replies as CORRECT. This will help community members and Qlik Employees know which discussions have already been addressed and have a possible known solution. Please mark threads with a LIKE if the provided solution is helpful to the problem, but does not necessarily solve the indicated problem. You can mark multiple threads with LIKEs if you feel additional info is useful to others.