Unlock a world of possibilities! Login now and discover the exclusive benefits awaiting you.
- Qlik Community
- :
- Forums
- :
- Forums by Product
- :
- Products (A-Z)
- :
- Qlik Sense
- :
- Documents
- :
- Generating AND, OR , NOT selection logic in Qlik S...
- Edit Document
- Move Document
- Delete Document
- Subscribe to RSS Feed
- Mark as New
- Mark as Read
- Bookmark
- Subscribe
- Printer Friendly Page
- Report Inappropriate Content
Generating AND, OR , NOT selection logic in Qlik Sense
- Move Document
- Delete Document and Replies
- Mark as New
- Bookmark
- Subscribe
- Mute
- Subscribe to RSS Feed
- Permalink
- Report Inappropriate Content
Generating AND, OR , NOT selection logic in Qlik Sense
'AND mode' is an out of box feature in QlikView whereby a QlikView developer a list box in a QlikView application to use 'AND mode' rather than the default 'OR mode'.
In Qlik Sense, its not there out of box in the same way, but some minor SET ANALYSIS expression syntax can create the right context on a chart to show the output in an "AND" context.
Attached is a self contained application that demonstrates the technique.
Please also refer to these screenshots:
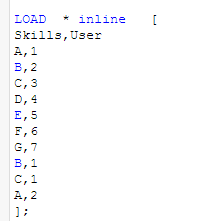
Here is the sample data... notice that Skill 'A' ,'B', and 'C' is associated only with User '1'. But User '1', '2', and '3' are collectively associated (OR mode) with the 'A','B', and 'C' set of skills
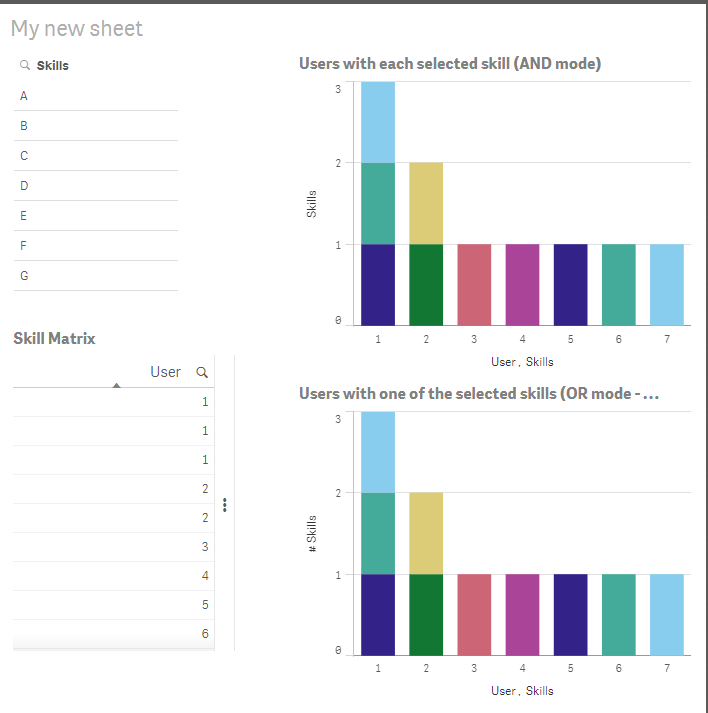
I have created an educational UI in the app to show how the default 'OR' mode chart contrasts with an 'AND' mode technique
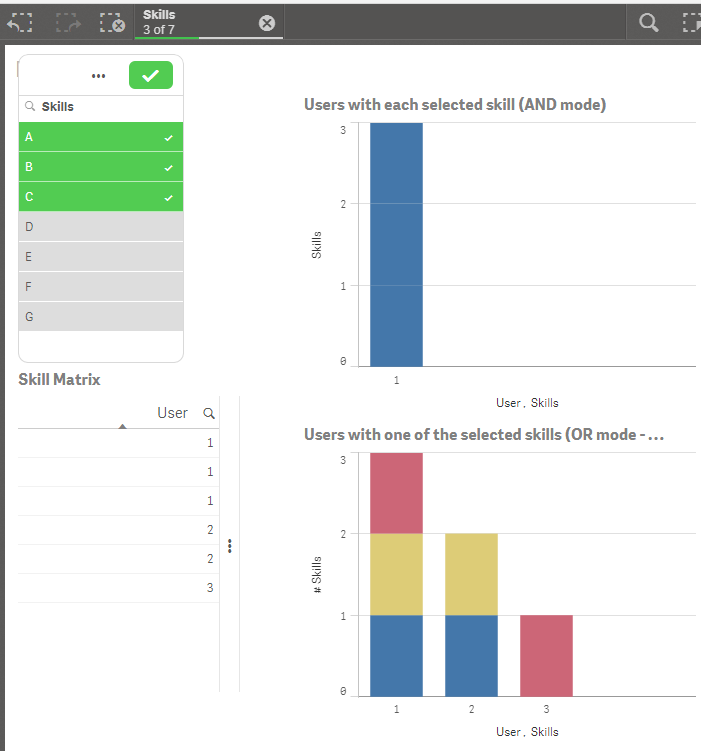
When i select Skills 'A', 'B' , and 'C' ... notice that the AND mode chart shows only User '1'.
But the OR mode chart shows Users '1', '2', and '3'
The OR mode expression is: count (distinct Skills)
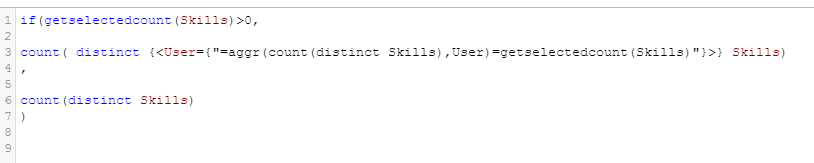
The measure expression on the AND mode is modified to the following.
Basically it filters the result to show only users where the unique number of skills associated to them is equivalent to the number of distinct skills selections in the UI.
hope it helps !
Version 2-3 update: Just added a NOT mode tab where you can combine AND with NOT and see a list of users with all the skills selected but exluding users who already have one or more skills selected from a different list. Full description below in the comments.
- Move Comment
- Delete Comment
- Mark as Read
- Mark as New
- Bookmark
- Permalink
- Report Inappropriate Content
Hi BogMgit,
Thanks for correcting Jonny's script. It works great! His script appears to be designed for use with one (target) field for one chart. I have 50 (target) product attribute fields! I can apply Jonny's script with your correction to each field, they work fine, but, as you might expect, each chart in which the target field appears is silo'd.
Are you working with more than one field and by chance merging the fields? if yes, can you share how you do this?
Oliver
- Move Comment
- Delete Comment
- Mark as Read
- Mark as New
- Bookmark
- Permalink
- Report Inappropriate Content
The script appears to work with multiple fields simply by intersecting "*" the scripts of each respective field. For example, here's how Jonny's script with the "Skills" field looks with a 2nd field, "State"; if anyone has a better approach, please weigh in:
*
- Move Comment
- Delete Comment
- Mark as Read
- Mark as New
- Bookmark
- Permalink
- Report Inappropriate Content
Does Jonny's solution preclude the use of OR logic in the chart, which displays output of AND and NOT selections?
In Qlikview, Qlik executes AND and NOT logic operation in a single list box. A user can apply AND logic, NOT logic or both in this box. In addition, this box and a standard OR logic list box can be placed side-by-side, and selections made in either box. In other words, OR, AND and NOT logic can be applied to the same field. While AND and NOT logic selections may remove selection previously made or preclude OR selections subsequently made, OR selections are still be possible. In other words, AND and NOT selections do not necessarily preclude OR selections.
Whereas, Jonny's script operates with separate AND and NOT logic filter panes (list boxes); and, the "AND" list box is actually a standard OR logic list box; but, it operates as an AND list box within the chart that displays the output of the AND and NOT selections.
To answer my question, I think it does preclude the use of OR logic in the chart. But please correct me if this is wrong.
Btw, how can Qlik Sense reasonably support human thought in Natural Language Processing if a user can't exercise OR, AND and NOT logic at will in the selection of field values?
- « Previous
-
- 1
- 2
- Next »