Unlock a world of possibilities! Login now and discover the exclusive benefits awaiting you.
- Qlik Community
- :
- Forums
- :
- Forums by Product
- :
- Products (A-Z)
- :
- Qlik Sense
- :
- Documents
- :
- How to Develop Qlik Sense Extensions from D3.js: T...
- Move Document
- Delete Document
- Subscribe to RSS Feed
- Mark as New
- Mark as Read
- Bookmark
- Subscribe
- Printer Friendly Page
- Report Inappropriate Content
How to Develop Qlik Sense Extensions from D3.js: Testing the D3 extension in HTML
- Move Document
- Delete Document and Replies
- Mark as New
- Bookmark
- Subscribe
- Mute
- Subscribe to RSS Feed
- Permalink
- Report Inappropriate Content
How to Develop Qlik Sense Extensions from D3.js: Testing the D3 extension in HTML
[2 - Testing the D3 visualization in HTML]
3 - Importing the D3 visualization into Qlik Sense
4 - Customizing the D3 with Qlik's data
5 - Drawing a second indicator as a reference line [coming soon]
6 - Creating Custom Settings by editing CSS from Javascript [coming soon]
2 - Testing the D3 visualization in HTML:
The D3.js code we’ll be using is here. Our goal in this section will be testing, exploring, and preparing our D3 visualization before we import it into Qlik Sense as an extension.
The first thing we’ll do is copy all of the HTML code under the visualization and paste it in the empty Test.html file we downloaded in the introduction article (here if you haven't).
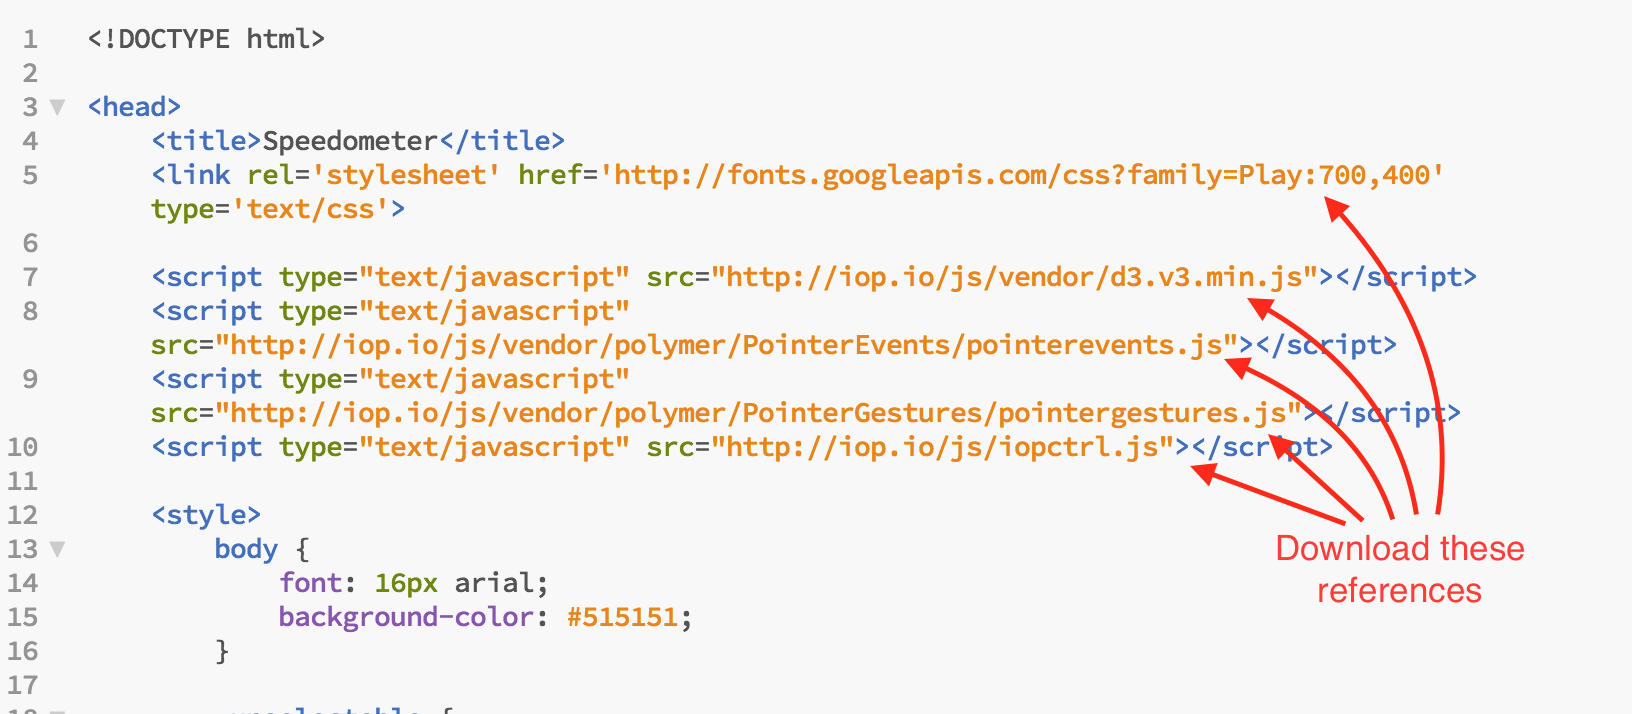
At the top of the HTML code, there are links to the necessary files the visualization uses to run. We’ll need to download these files by opening/saving their references before we jump into extension development. To save time, you can download them here and add them to our extension folder.

We’ll also cut the CSS stylizing code between the <style> tags in the HTML code and paste it in the empty “original.css” file we downloaded in the Introduction article (then get rid of the <style> tags).
After adding all these files to our extension folder, we’ll change the <link> tags at the top of our HTML to refer to them instead of the online links:
    <link rel='stylesheet' type='text/css' href="googleplay.css">
    <link rel='stylesheet' type='text/css' href="originald3.css">

    <script type="text/javascript" src="d3.min.js"></script>
    <script type="text/javascript" src="pointerevents.js"></script>
    <script type="text/javascript" src="pointergestures.js"></script>
    <script type="text/javascript" src="iopctrl.js"></script>
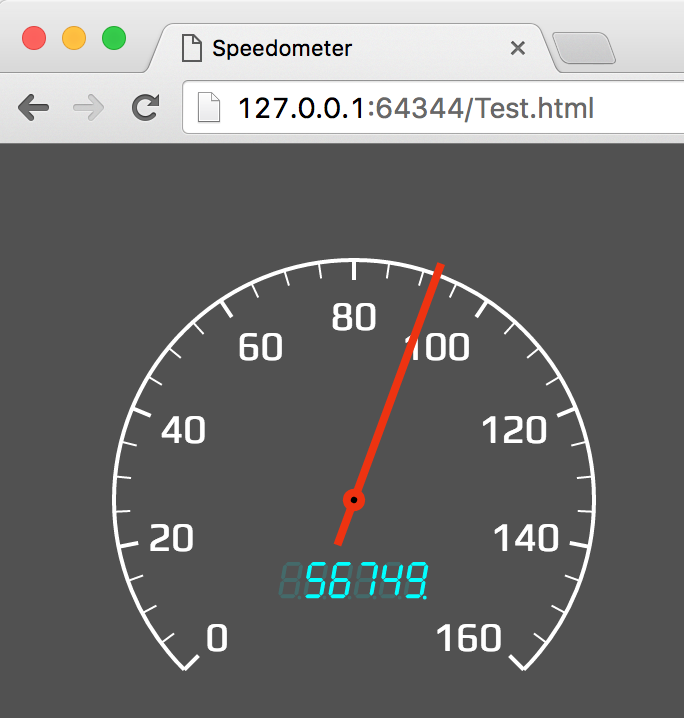
Now that we have all our resources ready (our extension folder should be like this now), we’ll execute our new .html file in a browser to check that the D3 visualization works before importing it as an extension in Qlik Sense.
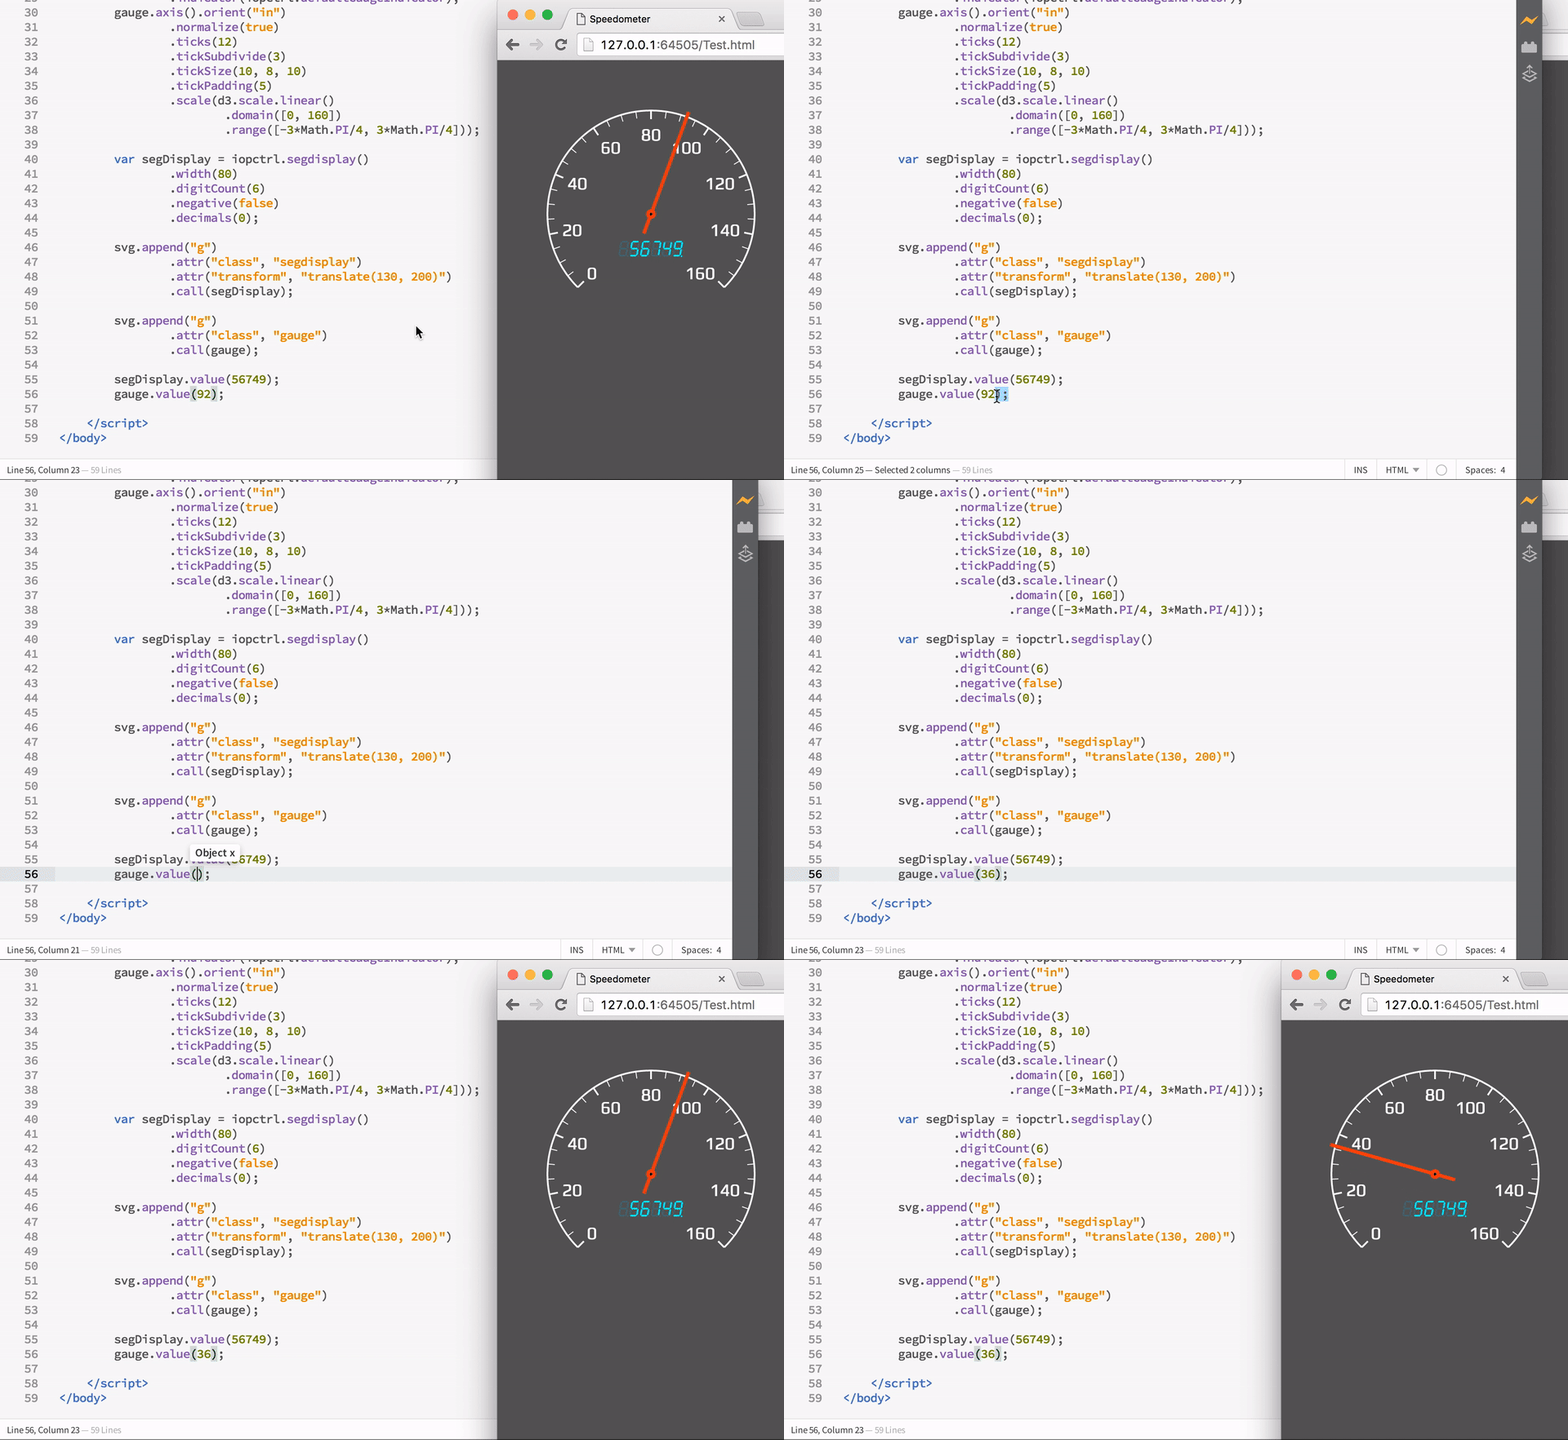
This is also a good place to check how the code works and change its variables around to understand what parts of the code changes what aspects of the visualization. For now, let's find out what changes the gauge's value. At the end of the javascript <script> tags, we'll find the line:
gauge.value(92);If we change the number 92 to 36, for instance, we can refresh the Test.html webpage in the browser to see the gauge indicator change to 36:

Now we have all our D3 files and testing area ready. In the next section, we’ll start importing the D3 visualization into Qlik as an extension.
- Move Comment
- Delete Comment
- Mark as Read
- Mark as New
- Bookmark
- Permalink
- Report Inappropriate Content
This is very helpful, I hope you'll continue those documents.
Thanks
- Move Comment
- Delete Comment
- Mark as Read
- Mark as New
- Bookmark
- Permalink
- Report Inappropriate Content
Good article - Thanks!. Easy to follow and for me quite handy as an intro to integrate D3 in QS.
PS: Do you still plan to complete the 2 "coming soon" parts"?
If not, I think you've given a good intro to find out ourselves 😉
- Move Comment
- Delete Comment
- Mark as Read
- Mark as New
- Bookmark
- Permalink
- Report Inappropriate Content
Hello! Who can send me files from dropbox? Link disabled