Unlock a world of possibilities! Login now and discover the exclusive benefits awaiting you.
- Qlik Community
- :
- Forums
- :
- Forums by Product
- :
- Products (A-Z)
- :
- Qlik Sense
- :
- Documents
- :
- Qlik Engine Health-Check Analysis (app included)
- Edit Document
- Move Document
- Delete Document
- Subscribe to RSS Feed
- Mark as New
- Mark as Read
- Bookmark
- Subscribe
- Printer Friendly Page
- Report Inappropriate Content
Qlik Engine Health-Check Analysis (app included)
- Move Document
- Delete Document and Replies
- Mark as New
- Bookmark
- Subscribe
- Mute
- Subscribe to RSS Feed
- Permalink
- Report Inappropriate Content
Qlik Engine Health-Check Analysis (app included)
Monitoring current performance and availability of Qlik Sense site is not out-of-the-box feature, but can be easily achieved with native REST connector and requesting engine\healthcheck JSON API.
There are other tools and approaches, but since I already have the best BI tool available 😉, I found it reasonable to use it. All that is necessary is just:
- download and import the attached app
- create REST Data Connections and adjust the settings in the script
- schedule app reload
This Qlik Sense app:
- loads engine\healthcheck JSON data from multiple nodes
- parses and consolidates it to two tables
- stores them to QVDs with all previous snapshots
- visualizes key metrics of engine utilization and availability in time
It's recommended to deploy and schedule this app on DEV or TEST site, pointing to all production nodes. Otherwise, there will be no data loaded in case the production engine (or the whole server) crashes.
(just FYI - DEV and TEST sites are included in the professional license subscription)
It's also recommended to read the official help site info about the engine API before you deploy this app.
After importing the app to a suitable site, follow these steps:
1. Decide on target folder for result QVD files, where parsed snapshot of JSON data will be stored. Create a folder Data Connection (if it doesn’t already exist) and set its Lib name to vQVDpath variable in Settings script section.
2. Create a REST Data Connection to each node:
URL: https://<server domain>/engine/healthcheck OR https://<node IP address>:4747/engine/healthcheck
Authentication Schema: Windows NTLM
User name & password: type root admin or service user credentials
check "Skip server certificate validation" if there is no valid certificate on target node
Query headers:
User-Agent: Windows
Cache-Control: no-cache
3. Adjust the INLINE table in the Settings section of the script according to your site
node - name of the node that will be shown for app’s user
restConnection - name of the REST connection that points to node’s engine/healthcheck
RAM - amount of node's memory in GB
CPU - number of node's logical processors
4. Schedule a reload task. The recommended app reload frequency is 5 minutes or less (tested reload duration on the 4-node site is 12 seconds). The script will return "N/A" in [isSaturated] field when the engine is not responding.
The current roadmap includes - script for email notifications, possibility to load only N days back, mapping app name to IDs, node comparisons.
PLEASE! If you make adjustments or additions to the script or front-end visualizations, please share them back on the Qlik Community.
Happy Qliking 🙂
-RADO-
- Move Comment
- Delete Comment
- Mark as Read
- Mark as New
- Bookmark
- Permalink
- Report Inappropriate Content
Hi, Rado
a great app that every administrator misses.
I installed it in a 3-node environment.
Simple configuration.
I look forward to further developing the application.
Happy Qliking 😎
Rudy
- Move Comment
- Delete Comment
- Mark as Read
- Mark as New
- Bookmark
- Permalink
- Report Inappropriate Content
Thanks for sharing such a useful app! 😊
Maria
- Move Comment
- Delete Comment
- Mark as Read
- Mark as New
- Bookmark
- Permalink
- Report Inappropriate Content
Hi Rad,
Can you please in detail what it means ?
It's recommended to deploy and schedule this app on DEV or TEST site, pointing to all production nodes. Otherwise, there will be no data loaded in case the production engine (or the whole server) crashes.
Thanks,
Rohit
- Move Comment
- Delete Comment
- Mark as Read
- Mark as New
- Bookmark
- Permalink
- Report Inappropriate Content
Hi Rohit,
It means that in case you reload the Engine Health-check app on a server, which is a part of your Production Site, you'll have data only when that site is live.
If it crashes (e.g. somebody runs a massive cartesian join and kills the engine which reloads this app), then the reload will not happen and there won't be a record in the app showing the engine was down.
That is why I recommend reloading this app on a Development or Testing site. Then, if the Production is down, you will see an "N/A" record in [isSaturated] field.
- Move Comment
- Delete Comment
- Mark as Read
- Mark as New
- Bookmark
- Permalink
- Report Inappropriate Content
"N/A" record in [isSaturated] field means the prod server was done for that time ?
- Move Comment
- Delete Comment
- Mark as Read
- Mark as New
- Bookmark
- Permalink
- Report Inappropriate Content
Thank you Alberto ( @Alberto-Piccoli ) for suggesting to add app info.
LIB CONNECT TO 'monitor_apps_REST_app';

RestConnectorMasterTable:
SQL SELECT
    "id",
    "createdDate",
    "name",
    "fileSize",
    "stream",
    "__KEY_root"
FROM JSON (wrap on) "root" PK "__KEY_root";

[Apps]:
LOAD
    [id] AS appId,
    [name] AS appName,
    [stream] as appStream,
    [fileSize],
    [createdDate]
RESIDENT RestConnectorMasterTable
WHERE NOT IsNull([__KEY_root]);

DROP TABLE RestConnectorMasterTable;
There are also other fields in the REST response. I just chose the once I found the most relevant.
If the site for reloading Engin HC app is different than the one being checked, it is necessary to create a relevant REST data connection to QRS (basically just copy settings from standard monitor_apps_REST_app and just change the server domain in URLs).
- Move Comment
- Delete Comment
- Mark as Read
- Mark as New
- Bookmark
- Permalink
- Report Inappropriate Content
Another nice suggestion from @eike_s to use WITH CONNECTION script function in the REST call. This will allow you to have only one Data Connection and direct the REST call to a specific node during the script execution.
1. modify the Settings section:
// Open a valid REST connection - only ONE is necessary
LIB CONNECT TO 'EngineHealthCheck';

// Define Node names, domain and node info
EngineNodes:
load * inline [
node, serverDomain, RAM, CPU,
CENTRAL, "localhost", 16, 4
PROD, "prod.emarkanalytics.com", 32, 8,
    ];
2. modify the Processing section
FOR i = 0 TO noofrows('EngineNodes') - 1

    let vNode = peek( 'node', i, 'EngineNodes' );
    let vServerDomain = peek( 'serverDomain', i, 'EngineNodes' );
    let vURL = 'https://' & vServerDomain & '/engine/healthcheck';

    CALL RestLoad
    CALL ResultParsing
    CALL StoreToQvdSnapshot

NEXT
3. modify the end of REST call in the the SUB - REST Load section
...
FROM JSON (wrap on) "root" PK "__KEY_root"
    WITH CONNECTION
        (
        URL "$(vURL)"
        );
- Move Comment
- Delete Comment
- Mark as Read
- Mark as New
- Bookmark
- Permalink
- Report Inappropriate Content
anyone have the issue that the number of users is always 1?
nevermind . got it working .. forgot " Cache-Control: no-cache"
- Move Comment
- Delete Comment
- Mark as Read
- Mark as New
- Bookmark
- Permalink
- Report Inappropriate Content
Thanks for the super useful app! We are looking at integrating it with our Teams using @s_kabir_rab 's post. What measures would you say should be seen as red (or yellow 😉) flags to raise notifications?
Regards,
Mauritz
- Move Comment
- Delete Comment
- Mark as Read
- Mark as New
- Bookmark
- Permalink
- Report Inappropriate Content
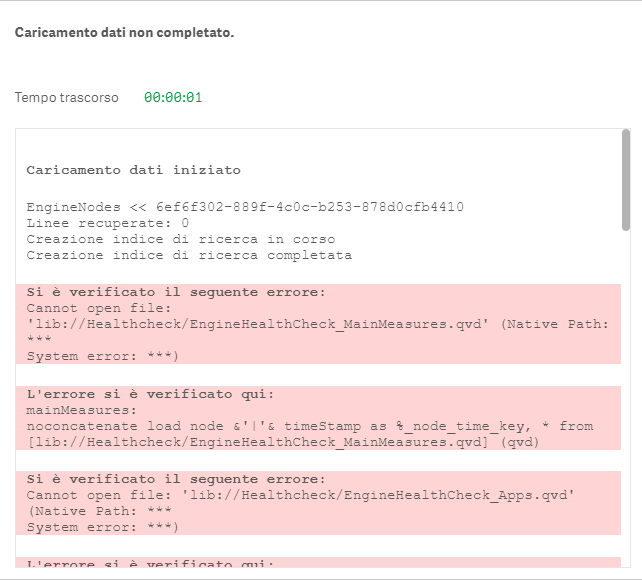
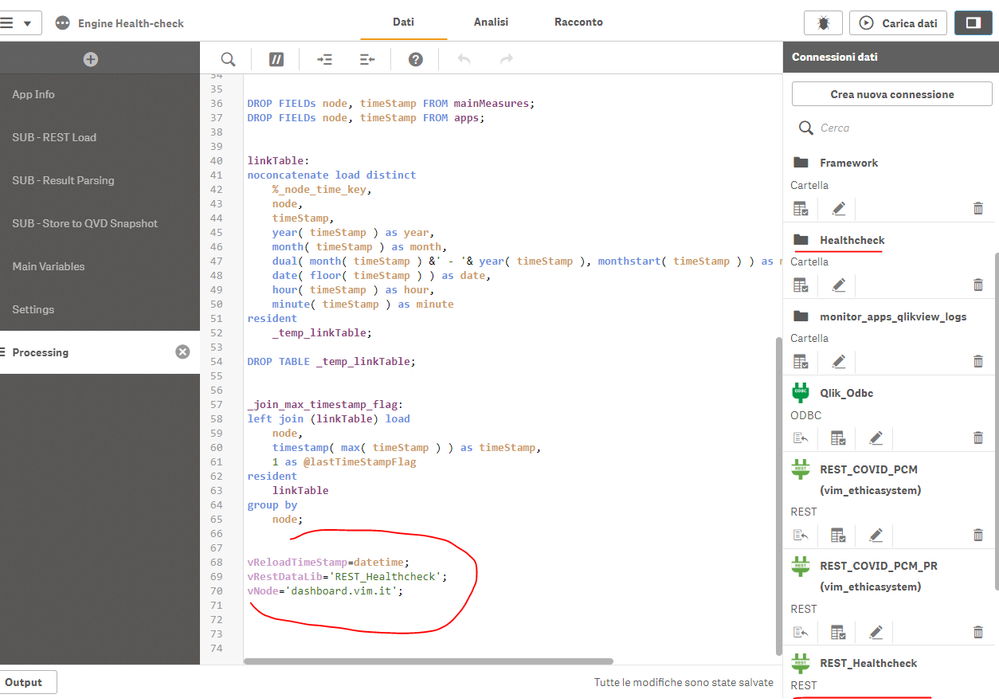
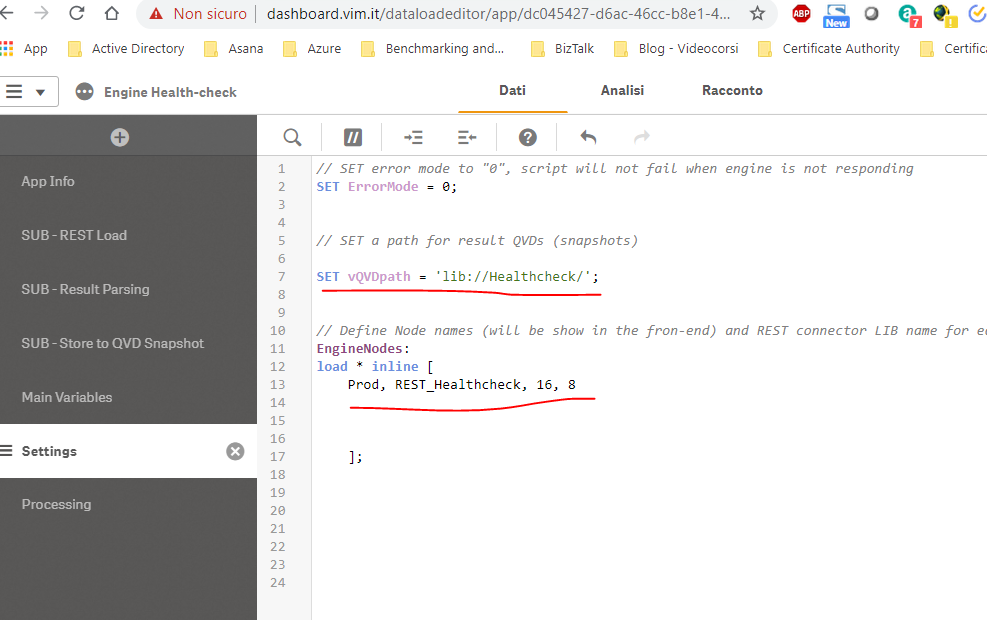
Hi guys, I'm definitely wrong. Can you help me out?
Attached are the error and configuration screens
Thank you


