Unlock a world of possibilities! Login now and discover the exclusive benefits awaiting you.
- Qlik Community
- :
- Forums
- :
- Forums by Product
- :
- Products (A-Z)
- :
- Qlik Sense
- :
- Documents
- :
- World Mapping File For Qlik Sense Maps (KML Shape ...
- Move Document
- Delete Document
- Subscribe to RSS Feed
- Mark as New
- Mark as Read
- Bookmark
- Subscribe
- Printer Friendly Page
- Report Inappropriate Content
World Mapping File For Qlik Sense Maps (KML Shape and Point)
- Move Document
- Delete Document and Replies
- Mark as New
- Bookmark
- Subscribe
- Mute
- Subscribe to RSS Feed
- Permalink
- Report Inappropriate Content
World Mapping File For Qlik Sense Maps (KML Shape and Point)
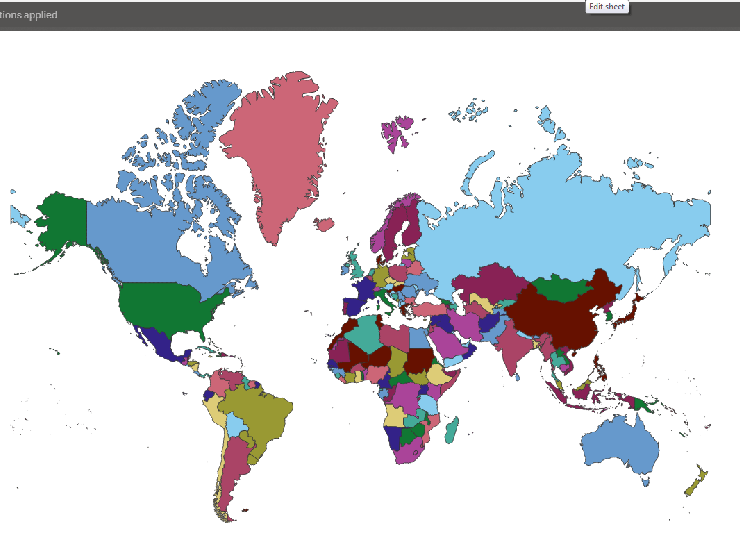
When building mapping visualizations in Qlik Sense, you will need either Lat & Long data to plot points on a map, or shape data to plot areas. For the latter, Qlik Sense will recognize KML files as a data format and load those natively. But shapes are merely a series of lat & long points that when plotted will connect up into a shape, such as a state or a sales region. When multiple shapes are plotted they can connect to form a country, or even a map of the world.
When plotting either points on a map or a series of shapes, you will need either the relevant Lat and Long data or shape data in your data model. It must also be associated the relevant field in your data model to allow you to plot the relationships. For example, to plot a series of bubbles on a world map to indicate population, you will need lat & long data for each country and you will need it linked to your population data on say country code.
UPDATE (8/7/2017): The new mapping object in Qlik Sense allows you to render maps without actually having the shape or point data in your data model. This is because the map object leverages a geospatial engine that recognizes country, state and town names dynamically. For more information refer to our help: https://help.qlik.com/en-US/sense/June2018/Subsystems/Hub/Content/Visualizations/Map/Map.htm
But where can you get such a data set? Well, there are many free location based data sets on the web, but often they are a bit fragmented and incomplete. To save you all a bit of time I have joined together a few files into a single world based location set, which contains the following for each country:
- Latitude & Longitude
- Country Shape data
- 2 char ISO code
- 3 char ISO code
- Short Name
- Full ISO Name
These are contained in the attached QVD file which I hope you find useful. When I get a chance I will also upload a Qlik Sense app with a few examples using the data. If you need some info on how to use the mapping object check out this great video from Mike TaralloQlik Sense - Creating a Map Visualization
- Move Comment
- Delete Comment
- Mark as Read
- Mark as New
- Bookmark
- Permalink
- Report Inappropriate Content
Great post!!
Thanks!
- Move Comment
- Delete Comment
- Mark as Read
- Mark as New
- Bookmark
- Permalink
- Report Inappropriate Content
The best world map data I've found so far. One reminder, as I forgot after loading this qvd...don't forget the Tag syntax in your script, ie...
Tag field WorldCountries.ShortName with $geoname;
Tag field WorldCountries.Point with $geopoint;
Tag field WorldCountries.Area with $geomultipolygon;
- Move Comment
- Delete Comment
- Mark as Read
- Mark as New
- Bookmark
- Permalink
- Report Inappropriate Content
Great work - thanks a lot!
There is only one little thing: it seems Taiwan is missing...
- Move Comment
- Delete Comment
- Mark as Read
- Mark as New
- Bookmark
- Permalink
- Report Inappropriate Content
Its controversial, but one of the data sets that I combined had Taiwan as part of Greater China. So I think that's where it ended up.
- Move Comment
- Delete Comment
- Mark as Read
- Mark as New
- Bookmark
- Permalink
- Report Inappropriate Content
One small step for one man = one giant leap for others. Thank you 
- Move Comment
- Delete Comment
- Mark as Read
- Mark as New
- Bookmark
- Permalink
- Report Inappropriate Content
Thanks Lee for the article!
When we started by using your KML file, we found the map to be a bit slow.
I tried to simplify the country boundaries. Here are a few sites that helped:
http://support.esri.com/technical-article/000012399
http://www.mapsdata.co.uk/online-file-converter/
Hope this helps!
-Regards.
- Move Comment
- Delete Comment
- Mark as Read
- Mark as New
- Bookmark
- Permalink
- Report Inappropriate Content
Hi Lee
Do you have any idea how I could group geopoints by kml boundary? What I have is a bucket load of latitude and longitude points, but no location details. I want to group these points into their appropriate countries.
- Move Comment
- Delete Comment
- Mark as Read
- Mark as New
- Bookmark
- Permalink
- Report Inappropriate Content
Hi Richard
I looked into that for a customer recently. There is no function within Qlik to work out which geo-boundary the points fall into. You would have to use a third party system to work out the country associations, or use a mapping extension that can can do it. Possibly MapInfo could do that.
- Move Comment
- Delete Comment
- Mark as Read
- Mark as New
- Bookmark
- Permalink
- Report Inappropriate Content
Great post! One minor thing. Lebanon and Botswana are overlapping. Is there a way to fix that?
Thanks!
- Move Comment
- Delete Comment
- Mark as Read
- Mark as New
- Bookmark
- Permalink
- Report Inappropriate Content
That is odd. Yes, you can edit the KML manually in a text editor (which is pretty awkward) or you could potentially use an online tool to get the correct shape of the offending country and then paste that over the relevant node in the file. (If only geopolitical solutions were that easy).