Unlock a world of possibilities! Login now and discover the exclusive benefits awaiting you.
- Qlik Community
- :
- All Forums
- :
- QlikView App Dev
- :
- 100% stacked bar chart
- Subscribe to RSS Feed
- Mark Topic as New
- Mark Topic as Read
- Float this Topic for Current User
- Bookmark
- Subscribe
- Mute
- Printer Friendly Page
- Mark as New
- Bookmark
- Subscribe
- Mute
- Subscribe to RSS Feed
- Permalink
- Report Inappropriate Content
100% stacked bar chart
Hi everyone,
I'm working on a 100% stacked bar chart.
I found some topics in the community regarding this question:
100% Stacked bar chart in Qlik Sense | Qlik Community
Keywords : TOTAL, ALL & DISTINCT
Regretfully, it doesn't seem to be working in my specific situation.
So, I already created a measure with this expression:
Count([Order Reference Deliveries])/Count(Total <Month> [Order Reference Deliveries])
And I created a stacked bar chart with these dimensions/measures:
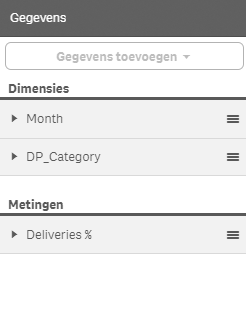
This is the result:
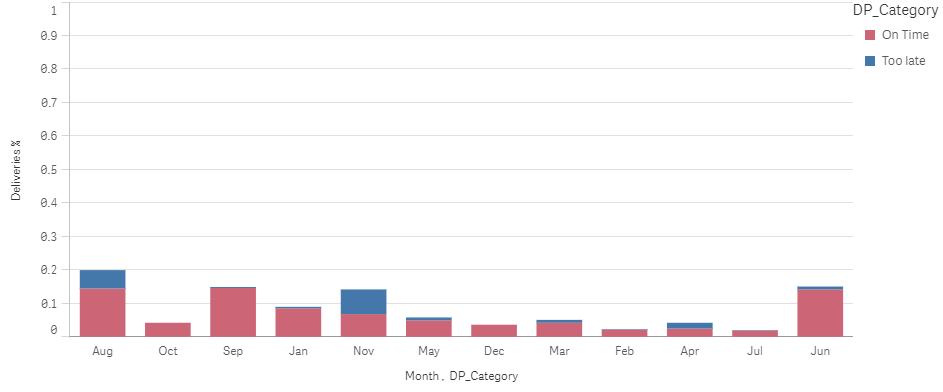
So.... what am I doing wrong?
- « Previous Replies
-
- 1
- 2
- Next Replies »
Accepted Solutions
- Mark as New
- Bookmark
- Subscribe
- Mute
- Subscribe to RSS Feed
- Permalink
- Report Inappropriate Content
I discovered the problem.
In my chart I used an old master dimension called 'Month', while in the meantime I had also created a master calender with the field 'Month'.
In the chart I replaced the master measure 'with the field, and now it's working:
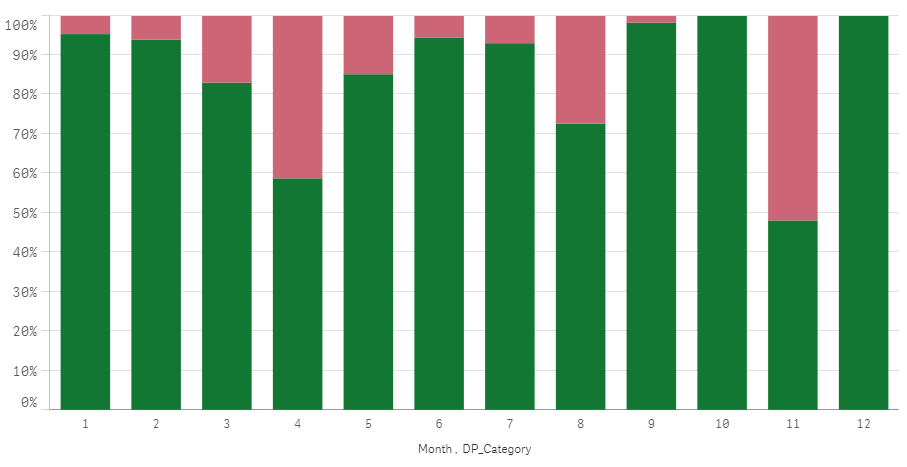
Knowing that, brings me to a new problem.
In reality I would like to use my master measure 'Period' instead of the Month field....because I want the combination month/year...
My master measure periode has this expression: Monthname(Date)
When I replace the dimension Month by the master dimension Period, I'm back where I started:
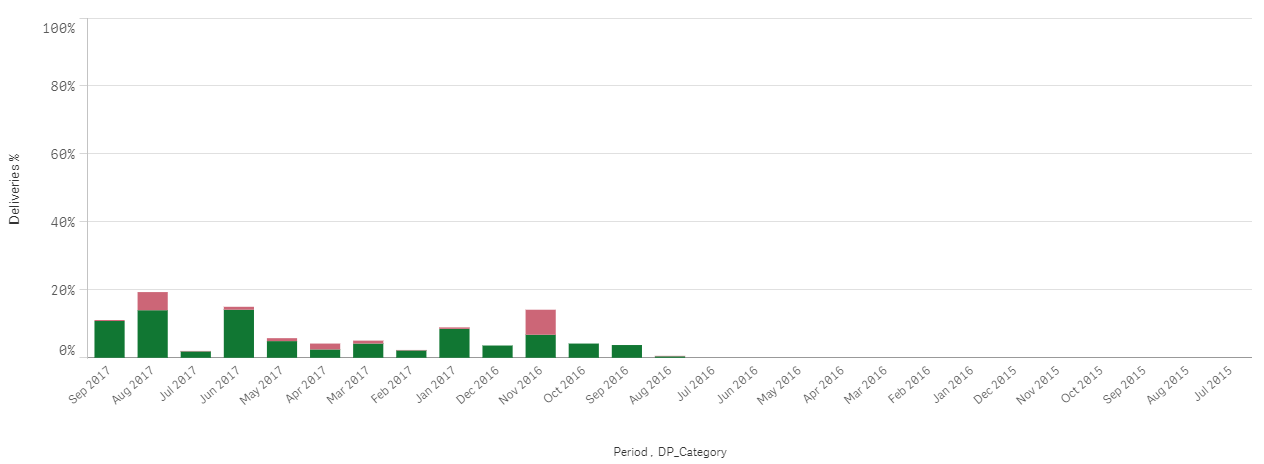
... and it's not possible to refer to a master dimension in a expression. So what do I do now? Do I have to get rid of my master dimension 'Period' and re-create it somehow in the master calendar?
- Mark as New
- Bookmark
- Subscribe
- Mute
- Subscribe to RSS Feed
- Permalink
- Report Inappropriate Content
Hi,
Have you set the Measures Number formatting to %?
- Mark as New
- Bookmark
- Subscribe
- Mute
- Subscribe to RSS Feed
- Permalink
- Report Inappropriate Content
Not in the example above. But I did try that, didn't help.
The problem is (in my opinion) that Qlik Sense won't use the <Month> 'filter' in the expression (after Total)
It seems that it divides by the total amount in stead of the amount of the specific month.
- Mark as New
- Bookmark
- Subscribe
- Mute
- Subscribe to RSS Feed
- Permalink
- Report Inappropriate Content
I discovered the problem.
In my chart I used an old master dimension called 'Month', while in the meantime I had also created a master calender with the field 'Month'.
In the chart I replaced the master measure 'with the field, and now it's working:

Knowing that, brings me to a new problem.
In reality I would like to use my master measure 'Period' instead of the Month field....because I want the combination month/year...
My master measure periode has this expression: Monthname(Date)
When I replace the dimension Month by the master dimension Period, I'm back where I started:

... and it's not possible to refer to a master dimension in a expression. So what do I do now? Do I have to get rid of my master dimension 'Period' and re-create it somehow in the master calendar?
- Mark as New
- Bookmark
- Subscribe
- Mute
- Subscribe to RSS Feed
- Permalink
- Report Inappropriate Content
Hi Gert,
Having a quick look I would assume that your data spans a number of years.
I would try the same thing, but total by the Month Year field, if you have one?
Mark
- Mark as New
- Bookmark
- Subscribe
- Mute
- Subscribe to RSS Feed
- Permalink
- Report Inappropriate Content
I think you will need to calculate MonthYear field in the script... Master dimension isn't going to work... what is the issue with doing MonthName(Date) as MonthYear in script?
- Mark as New
- Bookmark
- Subscribe
- Mute
- Subscribe to RSS Feed
- Permalink
- Report Inappropriate Content
Hi There
I am have similar issue where
I am using 2 dimensions and trying to create % stack graph.
I am using following expression
Please find attached screenshot.
Sum(Aggr(Max(PurchaseQuantity),LoanXID))/Sum(total Aggr(Max(PurchaseQuantity),LoanXID))
any suggestions?
- Mark as New
- Bookmark
- Subscribe
- Mute
- Subscribe to RSS Feed
- Permalink
- Report Inappropriate Content
May be this
Sum(Aggr(Max(PurchaseQuantity), LoanXID))/Sum(TOTAL <Arranger> Aggr(Max(PurchaseQuantity), LoanXID))
- Mark as New
- Bookmark
- Subscribe
- Mute
- Subscribe to RSS Feed
- Permalink
- Report Inappropriate Content
Thanks Sunny, it worked perfectly.
- Mark as New
- Bookmark
- Subscribe
- Mute
- Subscribe to RSS Feed
- Permalink
- Report Inappropriate Content
Let's give you guys an update.
I created a MonthYear field in the script, and now the problem is partly solved:
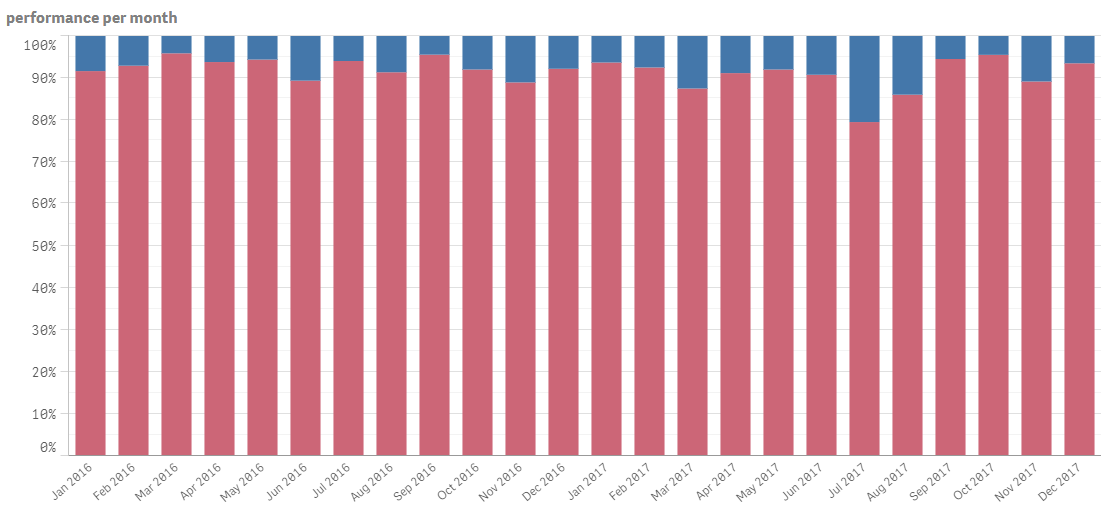
The measure will now only show the 24 rolling months (i'm using a flag in my master calendar for this)
Expression: Count({$<IsR24M={1}>}[Order Reference Deliveries])/Count({$<IsR24M={1}>} total <MonthnameYear>[Order Reference Deliveries])
Looks great? Indeed, but here's the new problem.
I really want to use custom colors (that's the reason why I was using the method above)
This is my color expression:
IF(DP_Category = 'Too late', RGB(131,208,245), IF(DP_Category = 'On time', RGB(0,108,183)))
When I add my color expression now, this is the result:
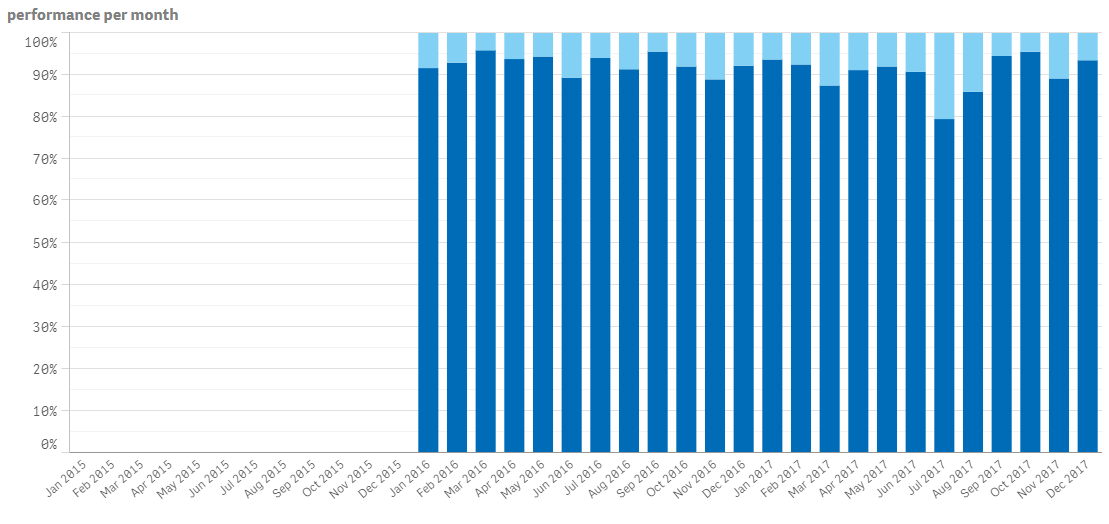
On the Y-axis, Qlik Sense is showing more than 24 months.
I did find some similar problems, but no solution:
Qlik Sense color expression issue | Qlik Community
Qlik Sense Color by Expression bug
How to resolve this?
Greetings
Gert
- « Previous Replies
-
- 1
- 2
- Next Replies »