Unlock a world of possibilities! Login now and discover the exclusive benefits awaiting you.
- Qlik Community
- :
- All Forums
- :
- QlikView App Dev
- :
- Re: 2 dimensions mapping in one chart issue
- Subscribe to RSS Feed
- Mark Topic as New
- Mark Topic as Read
- Float this Topic for Current User
- Bookmark
- Subscribe
- Mute
- Printer Friendly Page
- Mark as New
- Bookmark
- Subscribe
- Mute
- Subscribe to RSS Feed
- Permalink
- Report Inappropriate Content
2 dimensions mapping in one chart issue
Attached is the qvw file with an issue i have.
There are two dimensions:
Date1 and Date 2.
I've built two charts Chart 1 and Chart 2 with the according dimensions displayed.
What i need is to put both dimensions into one chart ("Chart Result").
Can you please advise on how to solve this?
Thanks!
- Tags:
- new_to_qlikview
- Mark as New
- Bookmark
- Subscribe
- Mute
- Subscribe to RSS Feed
- Permalink
- Report Inappropriate Content
ISn't it better like this ?
Chris
- Mark as New
- Bookmark
- Subscribe
- Mute
- Subscribe to RSS Feed
- Permalink
- Report Inappropriate Content
Concatenate the tables instead. See attached qvw.
talk is cheap, supply exceeds demand
- Mark as New
- Bookmark
- Subscribe
- Mute
- Subscribe to RSS Feed
- Permalink
- Report Inappropriate Content
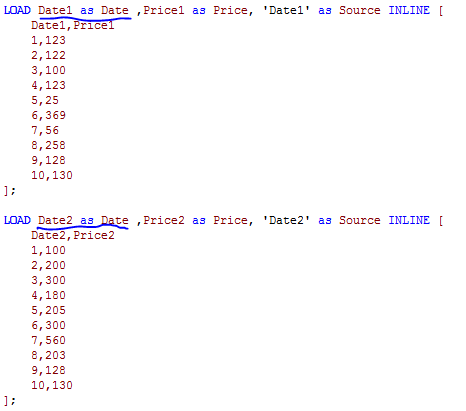
I've used your solution but encountered another issue. If i name Date 1 and Date 2 as Date (see below) data loop appears in the table viewer for my qvw in production. The one that i attached is an example of the problem. I have a complex data tables structure in the production file. Do you think there is another way of putting these dimensions into one chart?
- Mark as New
- Bookmark
- Subscribe
- Mute
- Subscribe to RSS Feed
- Permalink
- Report Inappropriate Content
Not with the result you're looking for. You will have to create a singe date dimension somehow and use that in your chart. Based on the document you posted I suggested concatenating your tables. Perhaps simply using another name as Date for the new field resolves the loop. No way of telling without knowing your data model.
You could also try creating a link table instead:
DateLink:
Load distinct Date1 as Date, Date1
resident Table1;
concatenate(DateLink)
Load distinct Date2 as Date, Date2
resident Table2;
talk is cheap, supply exceeds demand