Unlock a world of possibilities! Login now and discover the exclusive benefits awaiting you.
- Qlik Community
- :
- All Forums
- :
- QlikView App Dev
- :
- Re: 2 requirements in a Single Chart
- Subscribe to RSS Feed
- Mark Topic as New
- Mark Topic as Read
- Float this Topic for Current User
- Bookmark
- Subscribe
- Mute
- Printer Friendly Page
- Mark as New
- Bookmark
- Subscribe
- Mute
- Subscribe to RSS Feed
- Permalink
- Report Inappropriate Content
2 requirements in a Single Chart
Hi All,
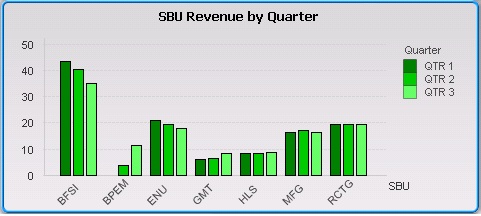
I have a requirement like this, where I have 2 dimensions: SBU, Quarter and a Measure: Revenue
- In a Bar chart I am showing the Total Revenue for different SBU by Quarters (where SBU is 1st dimension and Quarter is 2nd). THAT I AM ABLE TO DO LIKE BELOW SHOWN

- Now on the same chart, I also have to show the total Revenue for different SBU only (now not Quarter wise)
Can someone please help in showing one example/ideas?
Regards!!!
Accepted Solutions
- Mark as New
- Bookmark
- Subscribe
- Mute
- Subscribe to RSS Feed
- Permalink
- Report Inappropriate Content
Have a look at this blog post
http://community.qlik.com/blogs/qlikviewdesignblog/2014/01/31/customizable-straight-table
- Mark as New
- Bookmark
- Subscribe
- Mute
- Subscribe to RSS Feed
- Permalink
- Report Inappropriate Content
Add below in your script....
Considering your Fact Table is Temp:
Temp:
Load SBU, Quarter, Revenue From TableName;
Join
Load SBU, SUM(Revenue) as Revenue Resident Temp
Group By SBU;
Now Create a Bar Chart
Dimension
SBU
Quarter
Expression
SUM(Revenue)
- Mark as New
- Bookmark
- Subscribe
- Mute
- Subscribe to RSS Feed
- Permalink
- Report Inappropriate Content
Hi Manish,
Thank you for the response.
But I wanted a different chart/look which would show only SBU and Revenue. Some Button or Cyclic group kind of thing will help.
Can you help some?
- Mark as New
- Bookmark
- Subscribe
- Mute
- Subscribe to RSS Feed
- Permalink
- Report Inappropriate Content
Yup, a Drill Down or Cyclic group could be what you are after, so give it a go.
On the Dimension tab of your Bar Chart Properties click <Edit Groups>
- Mark as New
- Bookmark
- Subscribe
- Mute
- Subscribe to RSS Feed
- Permalink
- Report Inappropriate Content
HI Bill,
Can you please help on this?
- One chart would show SBU and Quarter
- Other chart should show ONLY SBU.
But both should be in a single place (Switching by Button/Cyclic group etc)
- Mark as New
- Bookmark
- Subscribe
- Mute
- Subscribe to RSS Feed
- Permalink
- Report Inappropriate Content
Aaahhh !! I understand what you are after now.
- Create Chart with both Dimensions
- For the Quarter tick <Enable Condition> and check whether a variable say vShowQuarter is 1
- Create a button with suitable actions to toggle the vShowQuarter variable between 0 and 1
You test first by changing the variable in an Input Box and add the button after that test.
- Mark as New
- Bookmark
- Subscribe
- Mute
- Subscribe to RSS Feed
- Permalink
- Report Inappropriate Content
Hi Bill,
Its getting more clear to me now. But could you please help a bit, by showing a small example.
It would be really helpful!
- Mark as New
- Bookmark
- Subscribe
- Mute
- Subscribe to RSS Feed
- Permalink
- Report Inappropriate Content
Have a look at this blog post
http://community.qlik.com/blogs/qlikviewdesignblog/2014/01/31/customizable-straight-table
- Mark as New
- Bookmark
- Subscribe
- Mute
- Subscribe to RSS Feed
- Permalink
- Report Inappropriate Content
Hi Bill,
This is an excellent learning.
Thanks for helping me out and showing this article. Kudos!