Unlock a world of possibilities! Login now and discover the exclusive benefits awaiting you.
- Qlik Community
- :
- All Forums
- :
- QlikView App Dev
- :
- Re: 6 Months rolling with cumulative of data
- Subscribe to RSS Feed
- Mark Topic as New
- Mark Topic as Read
- Float this Topic for Current User
- Bookmark
- Subscribe
- Mute
- Printer Friendly Page
- Mark as New
- Bookmark
- Subscribe
- Mute
- Subscribe to RSS Feed
- Permalink
- Report Inappropriate Content
6 Months rolling with cumulative of data
I have a requirement where i have to display the rolling 6 months in my dashboard, which i have already implemented with the below set analysis.
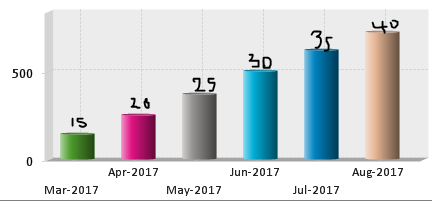
I have a chart, where rolling 6 months is done, from MARCH to AUGUST
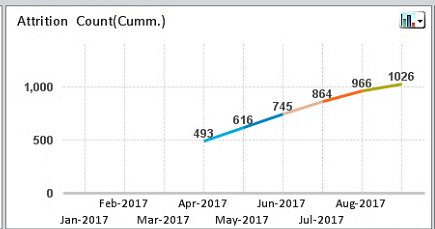
consider each month 5 employees are added. so this chart will display cumulative of previous month.

Expression i have used
(RangeSum(above( count({<Month_Year ={"$(v6Months)","$(v5Months)","$(v4Months)","$(v3Months)","$(v2Months)","$(vCurrentMonth)"}>}distinct empid),0,12)))
where variable v3Months = num#(DATE(AddMonths(max(Month_Year),-3),'MMM-YYYY'))
I have 5 employees been added in JAN and FEB also. so, i want to display those month(JAN, FEB) cumulative counts also in the chart as below so the march should have cumulative of jan and feb as 15 and so on
Help me in this...
Thanks
- Mark as New
- Bookmark
- Subscribe
- Mute
- Subscribe to RSS Feed
- Permalink
- Report Inappropriate Content
Thank you for your time pradosh.
I want to select the months from month filter and it should show me the selected months back to the minimum month..
month filters were not working in this.
It was really helpful Thanks again
- Mark as New
- Bookmark
- Subscribe
- Mute
- Subscribe to RSS Feed
- Permalink
- Report Inappropriate Content
close the thread by marking sunny's answer correct.
regards
Pradosh
- Mark as New
- Bookmark
- Subscribe
- Mute
- Subscribe to RSS Feed
- Permalink
- Report Inappropriate Content
Hi sunny,
Am reopening this thread again, as i have got some issue.
This expression works fine if am using it in Qlikview version 12 or higher.
The expression doesn't works, if i use it in Qlikview 11.
In version 11, i could see the months in the chart with no values in it.
Is that really a version problem ?
Help me in this.
- Mark as New
- Bookmark
- Subscribe
- Mute
- Subscribe to RSS Feed
- Permalink
- Report Inappropriate Content
First thing to check is if 'Suppress Zero Values' on the presentation tab is checked or not... if it is, then it might be a version issue, but not related to 11 or 12... it might be related to a very specific version issue like 11.2 SR13 or something like that
- Mark as New
- Bookmark
- Subscribe
- Mute
- Subscribe to RSS Feed
- Permalink
- Report Inappropriate Content
Thanks for replying.
Suppress Zero Values in Presentation tab is checked, but still its not working. I could see the bars.
If 'it might be related to a very specific version issue like 11.2 SR13 or something like that' is the case, then what can i do ?
- Mark as New
- Bookmark
- Subscribe
- Mute
- Subscribe to RSS Feed
- Permalink
- Report Inappropriate Content
Upgrade or downgrade 
- Mark as New
- Bookmark
- Subscribe
- Mute
- Subscribe to RSS Feed
- Permalink
- Report Inappropriate Content
Hi
what if you restrict the value to largest 6 values? without showing others value. You can set it in the dimension limits tab. you can give a try.
regards
Pradosh
- Mark as New
- Bookmark
- Subscribe
- Mute
- Subscribe to RSS Feed
- Permalink
- Report Inappropriate Content
I tried, not working
Restricting the values in dimension limits will not give the 6 months rolling and correct cumulative values. It will show the graph only with the largest values with their respective months..
- Mark as New
- Bookmark
- Subscribe
- Mute
- Subscribe to RSS Feed
- Permalink
- Report Inappropriate Content
Hi Kishore
I tried that in QV12 though . but it is working .
please supresszero values in presentation
and limit it to largest 6 values and not show others. The same example i tried .
regards
Pradosh
- Mark as New
- Bookmark
- Subscribe
- Mute
- Subscribe to RSS Feed
- Permalink
- Report Inappropriate Content
with the same expression what sunny provided ?