Unlock a world of possibilities! Login now and discover the exclusive benefits awaiting you.
- Qlik Community
- :
- All Forums
- :
- QlikView App Dev
- :
- Re: 6 Months rolling with cumulative of data
- Subscribe to RSS Feed
- Mark Topic as New
- Mark Topic as Read
- Float this Topic for Current User
- Bookmark
- Subscribe
- Mute
- Printer Friendly Page
- Mark as New
- Bookmark
- Subscribe
- Mute
- Subscribe to RSS Feed
- Permalink
- Report Inappropriate Content
6 Months rolling with cumulative of data
I have a requirement where i have to display the rolling 6 months in my dashboard, which i have already implemented with the below set analysis.
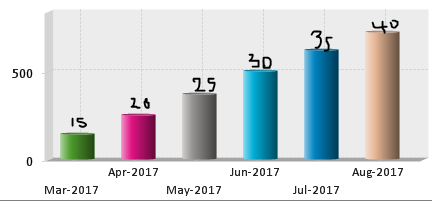
I have a chart, where rolling 6 months is done, from MARCH to AUGUST
consider each month 5 employees are added. so this chart will display cumulative of previous month.

Expression i have used
(RangeSum(above( count({<Month_Year ={"$(v6Months)","$(v5Months)","$(v4Months)","$(v3Months)","$(v2Months)","$(vCurrentMonth)"}>}distinct empid),0,12)))
where variable v3Months = num#(DATE(AddMonths(max(Month_Year),-3),'MMM-YYYY'))
I have 5 employees been added in JAN and FEB also. so, i want to display those month(JAN, FEB) cumulative counts also in the chart as below so the march should have cumulative of jan and feb as 15 and so on
Help me in this...
Thanks
- « Previous Replies
- Next Replies »
- Mark as New
- Bookmark
- Subscribe
- Mute
- Subscribe to RSS Feed
- Permalink
- Report Inappropriate Content
everything same ..
just the dimesnsion limit part.
- « Previous Replies
- Next Replies »