Unlock a world of possibilities! Login now and discover the exclusive benefits awaiting you.
- Qlik Community
- :
- All Forums
- :
- QlikView App Dev
- :
- Re: Accumulated quantity for each date/month betwe...
- Subscribe to RSS Feed
- Mark Topic as New
- Mark Topic as Read
- Float this Topic for Current User
- Bookmark
- Subscribe
- Mute
- Printer Friendly Page
- Mark as New
- Bookmark
- Subscribe
- Mute
- Subscribe to RSS Feed
- Permalink
- Report Inappropriate Content
Accumulated quantity for each date/month between a date range
Hi guys,
I'm trying to create a chart in Qlikview that gives the cumulative quantity for each date between a date range.
For eg. if the input excel data was :
| Product | Quantity | Start Date | End Date |
|---|---|---|---|
| X | 10 | 01/01/2017 | 03/15/2017 |
| Y | 5 | 02/06/2017 | 04/30/2017 |
| Z | 15 | 06/10/2017 | 08/03/2017 |
How can I create a bar chart from this data to look like this :
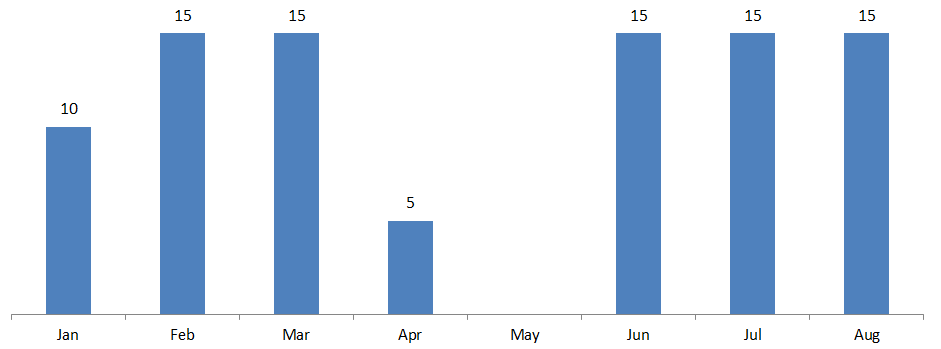
Any help would be much appreciated.
Thanks,
Ben
- Mark as New
- Bookmark
- Subscribe
- Mute
- Subscribe to RSS Feed
- Permalink
- Report Inappropriate Content
Hi Bennet
Table:
LOAD Product,
Quantity,
[Start Date],
[End Date],
MonthName(AddMonths([Start Date],IterNo()-1)) as Month
FROM
"https://community.qlik.com/message/1285250"
(html, codepage is 1252, embedded labels, table is @1)
While Month(AddMonths([Start Date],IterNo()-1)) <= Month([End Date]);
LOAD Min([Start Date]) as MinDate,Max([End Date]) as MaxDate
Resident Table;
Let vMinDate = (Peek('MinDate'));
Let vMaxDate = (Peek('MaxDate'));
LOAD DISTINCT MonthName($(vMinDate)+RecNo()-1) as Month
AutoGenerate $(vMaxDate)-$(vMinDate)+1;
Regards,
Antonio
- Mark as New
- Bookmark
- Subscribe
- Mute
- Subscribe to RSS Feed
- Permalink
- Report Inappropriate Content
Hey Antonio,
That does work, but if the data set is large and the date range is a couple of years apart it takes ages to load.
Ben
- Mark as New
- Bookmark
- Subscribe
- Mute
- Subscribe to RSS Feed
- Permalink
- Report Inappropriate Content
Another way (but it may not work with your data model)
Table:
LOAD Product,
Quantity,
[Start Date],
[End Date],
MonthName([Start Date]) as Month1,MonthName([End Date]) as Month2
FROM "https://community.qlik.com/message/1285250"
(html, codepage is 1252, embedded labels, table is @1);
LOAD Min([Start Date]) as MinDate,Max([End Date]) as MaxDate
Resident Table;
Let vMinDate = (Peek('MinDate'));
Let vMaxDate = (Peek('MaxDate'));
LOAD DISTINCT MonthName($(vMinDate)+RecNo()-1) as Month
AutoGenerate $(vMaxDate)-$(vMinDate)+1;
Dimension : Month
Expression : Sum(If(Month >= Month1 and Month <= Month2 ,Quantity))
- Mark as New
- Bookmark
- Subscribe
- Mute
- Subscribe to RSS Feed
- Permalink
- Report Inappropriate Content
That was clever but yea, I don't think it exactly fits my data model. Most of the time QV hangs when I try running the script.