Unlock a world of possibilities! Login now and discover the exclusive benefits awaiting you.
- Qlik Community
- :
- All Forums
- :
- QlikView App Dev
- :
- Re: Add coloumn in row
- Subscribe to RSS Feed
- Mark Topic as New
- Mark Topic as Read
- Float this Topic for Current User
- Bookmark
- Subscribe
- Mute
- Printer Friendly Page
- Mark as New
- Bookmark
- Subscribe
- Mute
- Subscribe to RSS Feed
- Permalink
- Report Inappropriate Content
Add coloumn in row
Hi Team,
I Have a data like this.
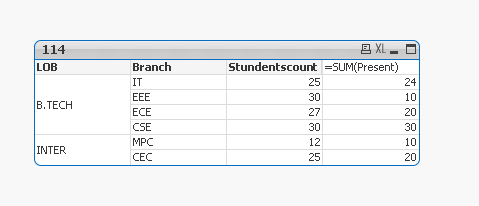
I want to add two additional rows into each LOB like Total and %.Please find below image.
.PNG)
In total 0.66 menas 66%
0.81 means 81%
- « Previous Replies
-
- 1
- 2
- Next Replies »
Accepted Solutions
- Mark as New
- Bookmark
- Subscribe
- Mute
- Subscribe to RSS Feed
- Permalink
- Report Inappropriate Content
This is what I have used in Script..
Data:
Load * Inline
[
LOB, Branch, Student, Present
B.TECH, IT, 25, 24
B.TECH, EEE, 30, 10
B.TECH, ECE, 27, 20
B.TECH, CSE, 30, 30
INTER, MPC, 12, 10
INTER, CTC, 25, 20
];
Dim:
LOAD * Inline [
Dim
1
2
3
];
Now create a Pivot Table
Dimension
1) LOB
2) =Pick(Dim, Branch, 'Total', '%')
Expression
1)
=Pick(Dim,
Sum(Student),
SUM({1<LOB,Branch>}Student),
Num(SUM(Student)/SUM({1}Total <LOB> Student),'#0%')
)
2)
=Pick(Dim,
Sum(Present),
SUM({<LOB, Branch>}Present),
Num(SUM(Present)/SUM({1}Total <LOB> Student),'#0%')
)
- Mark as New
- Bookmark
- Subscribe
- Mute
- Subscribe to RSS Feed
- Permalink
- Report Inappropriate Content
Could you provide a sample qvw?
- Mark as New
- Bookmark
- Subscribe
- Mute
- Subscribe to RSS Feed
- Permalink
- Report Inappropriate Content
Would you be able to share a sample to try this out?
- Mark as New
- Bookmark
- Subscribe
- Mute
- Subscribe to RSS Feed
- Permalink
- Report Inappropriate Content
Use like this..
Don't know how you got 0.66 and 0.81
- Mark as New
- Bookmark
- Subscribe
- Mute
- Subscribe to RSS Feed
- Permalink
- Report Inappropriate Content
Change the 2nd expression as below
=Pick(Dim,
Sum(Present),
SUM({1}Present),
Num(SUM(Present)/SUM({1}Total <LOB> Student),'#0%')
)
- Mark as New
- Bookmark
- Subscribe
- Mute
- Subscribe to RSS Feed
- Permalink
- Report Inappropriate Content
84/112 = 75% not 66%
- Mark as New
- Bookmark
- Subscribe
- Mute
- Subscribe to RSS Feed
- Permalink
- Report Inappropriate Content
Hi,
I don't think we can have totals come up as a percentage when the data-rows are in numbers.
One way could be to enable sub-totals and to then use the title to show the overall percentage of present. This way a user can select a particular LOB and see the % if required, and the sub-totals will always be there.
- Mark as New
- Bookmark
- Subscribe
- Mute
- Subscribe to RSS Feed
- Permalink
- Report Inappropriate Content
Hi Please share screen shot(UI+SCRIPT)...I have personal edition only...
- Mark as New
- Bookmark
- Subscribe
- Mute
- Subscribe to RSS Feed
- Permalink
- Report Inappropriate Content
Hi Bro..
This is sample data.I am not calculated %.Manualy Cteated.Please suggest me any idea...
- Mark as New
- Bookmark
- Subscribe
- Mute
- Subscribe to RSS Feed
- Permalink
- Report Inappropriate Content
This is what I have used in Script..
Data:
Load * Inline
[
LOB, Branch, Student, Present
B.TECH, IT, 25, 24
B.TECH, EEE, 30, 10
B.TECH, ECE, 27, 20
B.TECH, CSE, 30, 30
INTER, MPC, 12, 10
INTER, CTC, 25, 20
];
Dim:
LOAD * Inline [
Dim
1
2
3
];
Now create a Pivot Table
Dimension
1) LOB
2) =Pick(Dim, Branch, 'Total', '%')
Expression
1)
=Pick(Dim,
Sum(Student),
SUM({1<LOB,Branch>}Student),
Num(SUM(Student)/SUM({1}Total <LOB> Student),'#0%')
)
2)
=Pick(Dim,
Sum(Present),
SUM({<LOB, Branch>}Present),
Num(SUM(Present)/SUM({1}Total <LOB> Student),'#0%')
)
- « Previous Replies
-
- 1
- 2
- Next Replies »