Unlock a world of possibilities! Login now and discover the exclusive benefits awaiting you.
- Qlik Community
- :
- All Forums
- :
- QlikView App Dev
- :
- Re: Adding an avg row to straight table
- Subscribe to RSS Feed
- Mark Topic as New
- Mark Topic as Read
- Float this Topic for Current User
- Bookmark
- Subscribe
- Mute
- Printer Friendly Page
- Mark as New
- Bookmark
- Subscribe
- Mute
- Subscribe to RSS Feed
- Permalink
- Report Inappropriate Content
Adding an avg row to straight table
Hi all,
i need some help adding an average row to a straight table. i have 3 teams in my data with a 'Team Avg' row for each team. what i want is to add a rw to the bottom of my straight table showing the average of the 3 team avg's.
i have added a dummy value to my dimension called 'Total Avg' and now i am trying to find a way of averaging the 3 team avg's and putting that figure against the dummy figure created. if that makes sense!
what i want to achieve is something like the following.
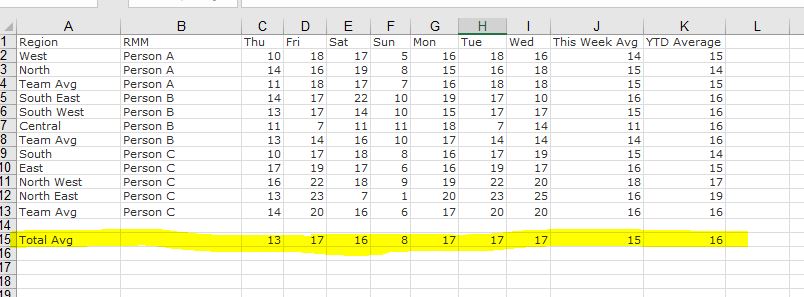
i have attached an example.
many thanks 
- « Previous Replies
-
- 1
- 2
- Next Replies »
- Mark as New
- Bookmark
- Subscribe
- Mute
- Subscribe to RSS Feed
- Permalink
- Report Inappropriate Content
i get the same value (34). im trying to see if i can get a better example qvw i can attach
- Mark as New
- Bookmark
- Subscribe
- Mute
- Subscribe to RSS Feed
- Permalink
- Report Inappropriate Content
Yes, that would be much helpful
Preparing examples for Upload - Reduction and Data Scrambling
- Mark as New
- Bookmark
- Subscribe
- Mute
- Subscribe to RSS Feed
- Permalink
- Report Inappropriate Content
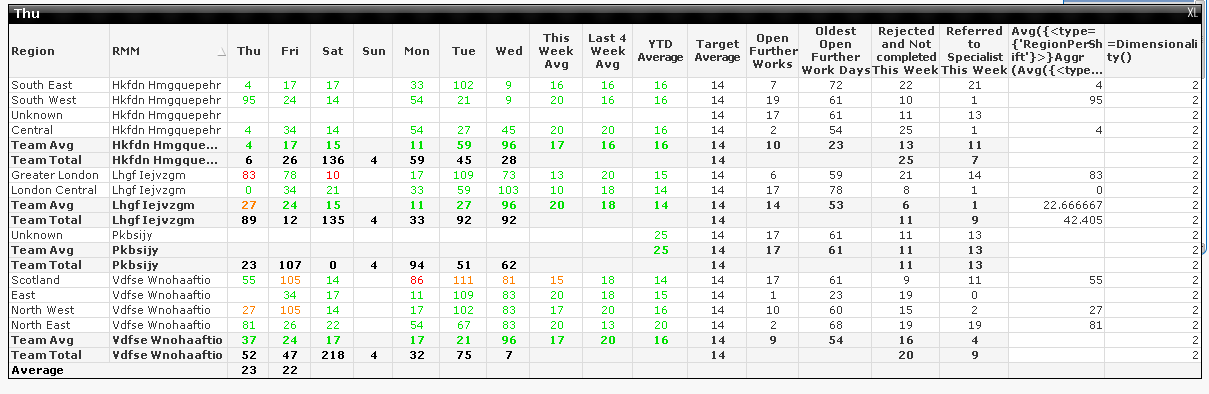
Hi Sunny, here is a scrambled version of what i am working on.
hopefully that will help. it has been saved with the required selections but in case you need them you need to select:
Year = 2017
Week = 6
type = RegionPerShift
Thanks for your help
- Mark as New
- Bookmark
- Subscribe
- Mute
- Subscribe to RSS Feed
- Permalink
- Report Inappropriate Content
What is the number you are looking to get here? 22.66?
- Mark as New
- Bookmark
- Subscribe
- Mute
- Subscribe to RSS Feed
- Permalink
- Report Inappropriate Content
Like this
- Mark as New
- Bookmark
- Subscribe
- Mute
- Subscribe to RSS Feed
- Permalink
- Report Inappropriate Content
perfect!! thanks so much for your help!
- « Previous Replies
-
- 1
- 2
- Next Replies »