Unlock a world of possibilities! Login now and discover the exclusive benefits awaiting you.
- Qlik Community
- :
- All Forums
- :
- QlikView App Dev
- :
- Re: Aggr function within Valueloop
- Subscribe to RSS Feed
- Mark Topic as New
- Mark Topic as Read
- Float this Topic for Current User
- Bookmark
- Subscribe
- Mute
- Printer Friendly Page
- Mark as New
- Bookmark
- Subscribe
- Mute
- Subscribe to RSS Feed
- Permalink
- Report Inappropriate Content
Aggr function within Valueloop
Hello,
I have created a Balanced Score Card Dashboard in QV12 using the Valueloop function. This allows me to enter the data cell by cell.
All works well except for one calculation that uses an aggregation:
SUM(AGGR(
IF((sum({1<OmzetKlant_ArtGrID-={9976,9961,9962,9963,9964,9966,9974,9975},OmzetKlant_VertegenwoordigerID={21,22,26,28}, CLJaar = {$(=Max(CLJaar))}, CLPeriode={$(=Max(CLPeriode))} >} OmzetKlant.Bedrag)-
(sum({1<OmzetKlant_ArtGrID-={9976,9961,9962,9963,9964,9966,9974,9975},OmzetKlant_VertegenwoordigerID={21,22,26,28}, CLJaar = {$(=Max(CLJaar)-1)}, CLPeriode={$(=Max(CLPeriode))}>} OmzetKlant.Bedrag)*1.03))
>0,
(sum({1<OmzetKlant_ArtGrID-={9976,9961,9962,9963,9964,9966,9974,9975},OmzetKlant_VertegenwoordigerID={21,22,26,28}, CLJaar = {$(=Max(CLJaar))},CLPeriode={$(=Max(CLPeriode))} >}OmzetKlant.Bedrag)-
(sum({1<OmzetKlant_ArtGrID-={9976,9961,9962,9963,9964,9966,9974,9975},OmzetKlant_VertegenwoordigerID={21,22,26,28}, CLJaar = {$(=Max(CLJaar)-1)}, CLPeriode={$(=Max(CLPeriode))}>} OmzetKlant.Bedrag)*1.03))
,0), OmzetKlant_KlantID))
The function calulates which customers have a growth of over 3% in turnover; the ones that do, their growth is summarized.
This function works great as an expression within a regular table, but it returns 0 in my BSC table.
My workaround is creating a text box and positioning this on top of the correct cell of the BSC Dashboard, but that looks poor as positioning with QV and Accesspoint differ.
Does anyone have suggestions for a formula that I can use in my BSC Dashboard?
- « Previous Replies
-
- 1
- 2
- Next Replies »
- Mark as New
- Bookmark
- Subscribe
- Mute
- Subscribe to RSS Feed
- Permalink
- Report Inappropriate Content
Hi Sunny,
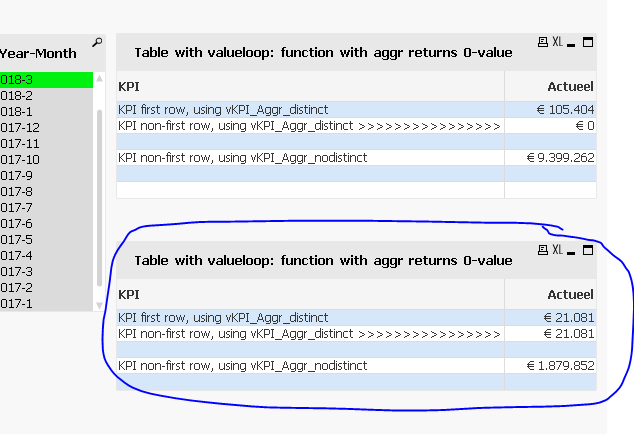
I have attached an example. The table shows 3 lines:
- line 1 shows aggr function that shows correct result
- line 2 shows aggr function that shows incorrect result (0)
- line 3 shows aggr function that shows incorrect result based on nodistinct
I have also added a text object that returns the correct result.
- Mark as New
- Bookmark
- Subscribe
- Mute
- Subscribe to RSS Feed
- Permalink
- Report Inappropriate Content
I am not sure I have answer for why this doesn't work with ValueLoop, but you can try with an Island table. I add this table your dashboard using binary load
Dim:
LOAD RowNo() as Dim
AutoGenerate 5;
and now use Dim as dimension rather than using ValueLoop
- Mark as New
- Bookmark
- Subscribe
- Mute
- Subscribe to RSS Feed
- Permalink
- Report Inappropriate Content
Interesting. Looks like an easy approach. I don't understand why the first line of the original table shows a different number now.
I have created the Dim dimension and replaced the valueloop() with Dim in my actual app. I'm not getting it to work though, it still returns a 0. Did I miss anythihng?
- Mark as New
- Bookmark
- Subscribe
- Mute
- Subscribe to RSS Feed
- Permalink
- Report Inappropriate Content
Did you add Dim to Aggr()'s dimension?
- Mark as New
- Bookmark
- Subscribe
- Mute
- Subscribe to RSS Feed
- Permalink
- Report Inappropriate Content
That's the trick! 
- Mark as New
- Bookmark
- Subscribe
- Mute
- Subscribe to RSS Feed
- Permalink
- Report Inappropriate Content
Yup, because ValueLoop is not a real dimension... it can't be added to Aggr() and that is why Dim works and ValueLoop doesn't
- « Previous Replies
-
- 1
- 2
- Next Replies »