Unlock a world of possibilities! Login now and discover the exclusive benefits awaiting you.
- Qlik Community
- :
- All Forums
- :
- QlikView App Dev
- :
- Re: Aligning grid lines for two y axes
- Subscribe to RSS Feed
- Mark Topic as New
- Mark Topic as Read
- Float this Topic for Current User
- Bookmark
- Subscribe
- Mute
- Printer Friendly Page
- Mark as New
- Bookmark
- Subscribe
- Mute
- Subscribe to RSS Feed
- Permalink
- Report Inappropriate Content
Aligning grid lines for two y axes
Hello,
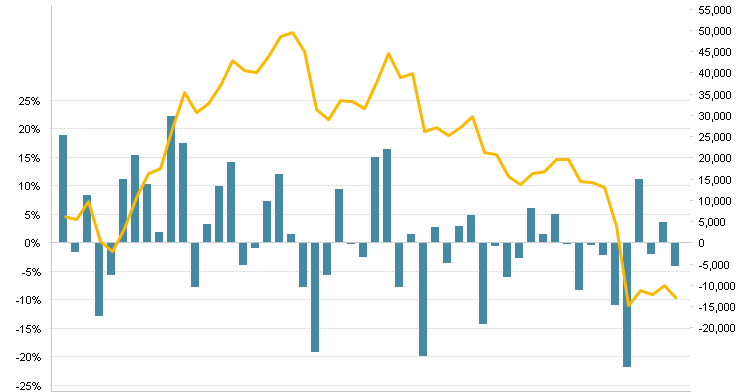
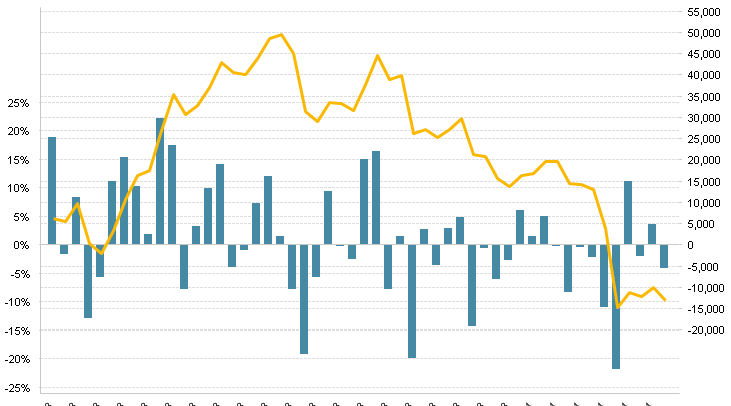
I have a chart with two y axes. I would like to show grid lines for both, though these are not exactly aligned. Is there a way to force this alignment?
Chart with one set of grid lines (not ideal):

Chart with both grid lines, not aligned:

Thank you,
M
- Mark as New
- Bookmark
- Subscribe
- Mute
- Subscribe to RSS Feed
- Permalink
- Report Inappropriate Content
Yes, it's possible. You need to set the minimum, maximum and step values for the axes. See attached example.
talk is cheap, supply exceeds demand
- Mark as New
- Bookmark
- Subscribe
- Mute
- Subscribe to RSS Feed
- Permalink
- Report Inappropriate Content
Hi Gysbert,
Thanks very much for this - this is certainly true. Do you know if this is possible to do if you didn't want static axes?
Thanks
M
- Mark as New
- Bookmark
- Subscribe
- Mute
- Subscribe to RSS Feed
- Permalink
- Report Inappropriate Content
Using these settings don't necessarily mean static axes. You can use expressions to calculate the values for these settings. But afaik know it is impossible to allign the grids without making sure they both get the same number of intervals of the same size using the minimum, maximum and step settings.
talk is cheap, supply exceeds demand