Unlock a world of possibilities! Login now and discover the exclusive benefits awaiting you.
- Qlik Community
- :
- All Forums
- :
- QlikView App Dev
- :
- Re: Average collection days in % of total outstand...
- Subscribe to RSS Feed
- Mark Topic as New
- Mark Topic as Read
- Float this Topic for Current User
- Bookmark
- Subscribe
- Mute
- Printer Friendly Page
- Mark as New
- Bookmark
- Subscribe
- Mute
- Subscribe to RSS Feed
- Permalink
- Report Inappropriate Content
Average collection days in % of total outstanding amount
Hi guys,
I have a table that looks like this:
Customer Invoice Date Payment Date Average Collection Days Amount
I was wondering how I can (or if I can) make a chart showing =SUM(Amount) with Customer as the dimension, but where the SUM(Amount) is split in % based on the Average Collection Days.
Regards
Thor
- Mark as New
- Bookmark
- Subscribe
- Mute
- Subscribe to RSS Feed
- Permalink
- Report Inappropriate Content
Hi.
What should be split the total sum of the customer over the invoices or the total sum over the customers.
In other words what dimensions are you supposed to use in chart.
- Mark as New
- Bookmark
- Subscribe
- Mute
- Subscribe to RSS Feed
- Permalink
- Report Inappropriate Content
Hey Thor,
Rather than taking a stab at this it sounds like there could be a little more clarification provided. When you state that you want the SUM([Amount])] split based on the %, it sounds like you're looking to allocate a % of that amount into another "bucket" or "classification" (e.g. "Late Dollar", "Penalty Amount", etc.).
If that is the case, you may want to calculate that "classification" or "bucket" within the LOAD statement based around an IF statement if the splits are fixed %'s/amounts.
If you're able provide more info and context.
Thanks,
- Mark as New
- Bookmark
- Subscribe
- Mute
- Subscribe to RSS Feed
- Permalink
- Report Inappropriate Content
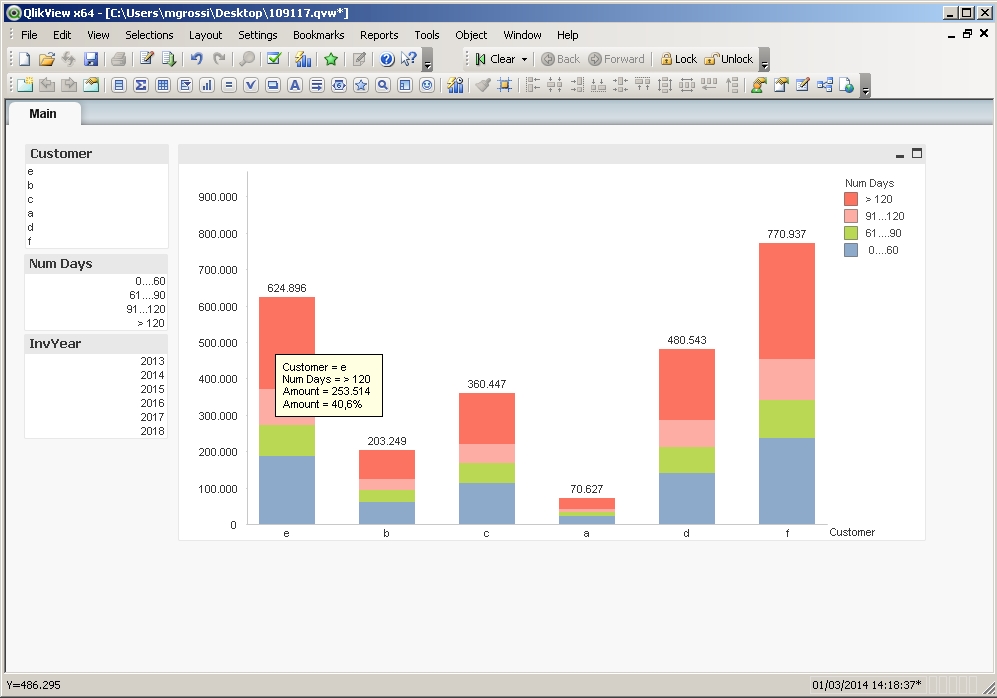
What I am looking for is a bar chart, with one bar per customer showing the total amount (SUM(AMOUNT)).
But I want this bar to be split into different colors depending on how much of that amount is within certain buckets of Collection days.
So, if customer A has SUM(AMOUNT) of 100 000, where 50 000 has an invoice date of 01.01.2013 and a payment date of 31.01.2013, then 50 000 should be colored blue because it is within aging bucket 0-60 days.
10 000 has been paid 30.04.2013 and should be green because it has been paid within the 61-90 days bucket etc.
Hope this made it more clear.
Regards
Thor
- Mark as New
- Bookmark
- Subscribe
- Mute
- Subscribe to RSS Feed
- Permalink
- Report Inappropriate Content
Customer is the dimension. Please see below for further explanation.
Thanks 
- Mark as New
- Bookmark
- Subscribe
- Mute
- Subscribe to RSS Feed
- Permalink
- Report Inappropriate Content
little clear but better if you provide some data (i.e. at least for 4-5 customers)
- Mark as New
- Bookmark
- Subscribe
- Mute
- Subscribe to RSS Feed
- Permalink
- Report Inappropriate Content
Hi Thor
See the Attachment.
Is this what you want???
Regards
Aviral
- Mark as New
- Bookmark
- Subscribe
- Mute
- Subscribe to RSS Feed
- Permalink
- Report Inappropriate Content
If you need Percentage wise Bars, see the Attachment.
Regards
Aviral Nag
- Mark as New
- Bookmark
- Subscribe
- Mute
- Subscribe to RSS Feed
- Permalink
- Report Inappropriate Content
see attachment