Unlock a world of possibilities! Login now and discover the exclusive benefits awaiting you.
- Qlik Community
- :
- All Forums
- :
- QlikView App Dev
- :
- Re: Average count of subgroups
- Subscribe to RSS Feed
- Mark Topic as New
- Mark Topic as Read
- Float this Topic for Current User
- Bookmark
- Subscribe
- Mute
- Printer Friendly Page
- Mark as New
- Bookmark
- Subscribe
- Mute
- Subscribe to RSS Feed
- Permalink
- Report Inappropriate Content
Average count of subgroups
Hi All,
I was hoping to get some help on the below which I cannot seem to find a solution for.
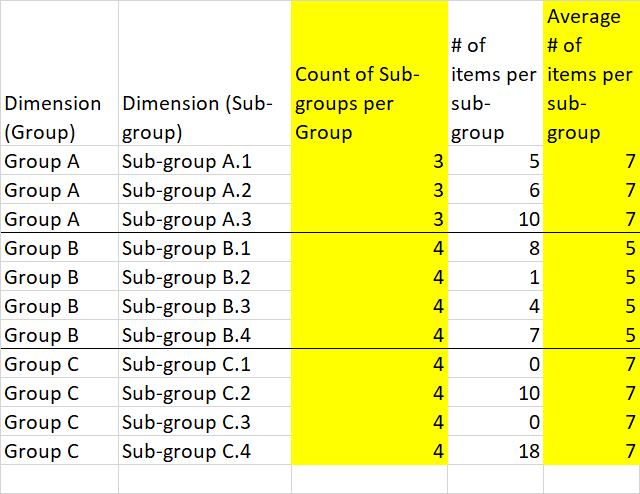
I need to create a chart which counts the average number of items per group/ sub-group, and also the deviation away from the average for each number in the sub-group.
Basically I am trying to calculate the mean/ average count of items per dimension group (the columns in yellow are where I need the help).
In the below example:
How to count number of sub-groups per Group
How to calculate average # of items in each Group.
Next step will be to calculate the deviation from the average for each Group
I assume I will need the aggr function, but I have little experience with Aggr and I am struggling to see how to apply the formula.
Many thanks!
Accepted Solutions
- Mark as New
- Bookmark
- Subscribe
- Mute
- Subscribe to RSS Feed
- Permalink
- Report Inappropriate Content
May be this
How to count number of sub-groups per Group
Count(DISTINCT TOTAL <Group> Sub-Group)
How to calculate average # of items in each Group.
Avg(TOTAL <Group> Aggr(Count(Items), Group, [Sub-Group]))
Stdev will be like this
Stdev(TOTAL <Group> Aggr(Count(Items), Group, [Sub-Group]))
- Mark as New
- Bookmark
- Subscribe
- Mute
- Subscribe to RSS Feed
- Permalink
- Report Inappropriate Content
Thanks - that was extremely helpful.