Unlock a world of possibilities! Login now and discover the exclusive benefits awaiting you.
- Qlik Community
- :
- All Forums
- :
- QlikView App Dev
- :
- Average last 30 days
- Subscribe to RSS Feed
- Mark Topic as New
- Mark Topic as Read
- Float this Topic for Current User
- Bookmark
- Subscribe
- Mute
- Printer Friendly Page
- Mark as New
- Bookmark
- Subscribe
- Mute
- Subscribe to RSS Feed
- Permalink
- Report Inappropriate Content
Average last 30 days
Hi,
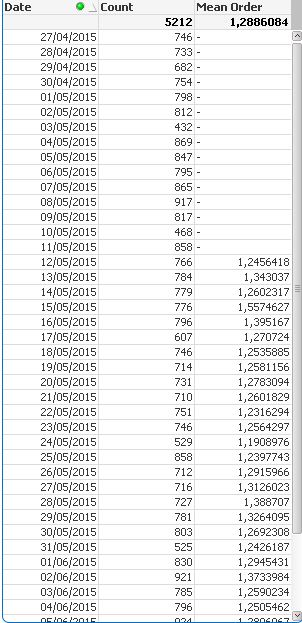
I just created a table with the count number of customers for evey area and as a dimension the last 45 days. But I would like to have a new expression to know the average orders for the last 30 days.
Anyone can help to me?
Expression last 45 days:
Count(DISTINCT{<[SALESID]={'PV0***'},
CREATEDDATETIME={'>=$(=today()-45)<=$(=today())'}} CUSTACCOUNT_CONTADOR)
Many thank's
- Mark as New
- Bookmark
- Subscribe
- Mute
- Subscribe to RSS Feed
- Permalink
- Report Inappropriate Content
Hi Eduard,
Have you tried something similar to the below?
"Avg(Aggr(Count(DISITINCT{<[SALESID]={'PV0***'},CREATEDDATETIME={'>=$(=today()-30)<=$(=today())'}} CUSTACCOUNT_CONTADOR), [SALESID]))"
Thanks
- Mark as New
- Bookmark
- Subscribe
- Mute
- Subscribe to RSS Feed
- Permalink
- Report Inappropriate Content
Hi.
The dimension period is different for 45 days and of 35 days, obviously. So,dimension will be filled for range of 45 days, the greater.
Note that, the second expression will be filled to the 30 day period. The others are null "(-)".
Expression last 30 days would be:
AVG({<[SALESID]={'PV0***'},
CREATEDDATETIME={'>=$(=today()-30)'}>} FIELDORDER)
See result in attached.
Hope this helps!
- Mark as New
- Bookmark
- Subscribe
- Mute
- Subscribe to RSS Feed
- Permalink
- Report Inappropriate Content
Hi all,
I tryied to do all you proposed but did not works.
Jonas, I did not understand to you about the dimension. Dimension is "flat" not calculated, I attached the table and see the real problem.
Many thank's for your help.
Eduard
- Mark as New
- Bookmark
- Subscribe
- Mute
- Subscribe to RSS Feed
- Permalink
- Report Inappropriate Content
Hi, Eduard.
Verify qvw in attached.
Was cloned the object with the field last 30 days and included one observation, more object text containing explication.
Hope it helps!
- Mark as New
- Bookmark
- Subscribe
- Mute
- Subscribe to RSS Feed
- Permalink
- Report Inappropriate Content
Hi Jonas,
First thank's for your help, but the expresion you did returs the Ticket Average, I'm looking theAverage number of orders for the dimension date from the dimension date minus 30 days....
I tryied to do with the File attached, but did not work
Many thank's
- Mark as New
- Bookmark
- Subscribe
- Mute
- Subscribe to RSS Feed
- Permalink
- Report Inappropriate Content
Hi.
See if I understand.
The average for 3625 orders in 34 days is equal 106,61.
Case afirmative, perform the following steps in the Chart Properties:
- In expression tab, select expression Last 30 Days Avg
- In Total Model alter of Expression Total for Mean of Lines.
- Click Ok button.
See figures in attached.
- Mark as New
- Bookmark
- Subscribe
- Mute
- Subscribe to RSS Feed
- Permalink
- Report Inappropriate Content
Hi Jonas,
I think I did not explain to you.
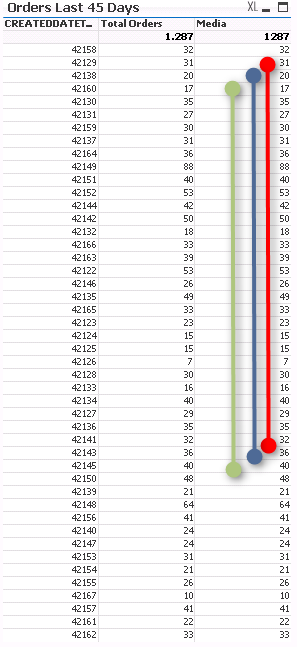
For example the cell for date: 42129, the Average (Media) Cell has to be the average for the last 30 days from 42129 (Red line)
For the next cell, the green one is from date: 42138 and the calculation is from 42138 minus 30 days
So sorry the head hache
Regards
Edu
- Mark as New
- Bookmark
- Subscribe
- Mute
- Subscribe to RSS Feed
- Permalink
- Report Inappropriate Content
Eduard.
If you haven't resolvid.
Please, make one example in flat file, presentation on the table data (Streight Table - Orders Last 45 Days), and share us.
It makes it easy our undertanding to help you.
- Mark as New
- Bookmark
- Subscribe
- Mute
- Subscribe to RSS Feed
- Permalink
- Report Inappropriate Content
Hi Jonas,
No, I did not solved the problem. I attached the chart to see how I did the calculation.
for each Row (or dimension day) I'm calculating the number of orders for each area. And there is another calculation and here it it is the issue. "Last 30 Days Average" cell wants to calculate the date or row minus 30 average orders. WOW!!! and for each row or date!!!
Many thank's
Eduard