Unlock a world of possibilities! Login now and discover the exclusive benefits awaiting you.
- Qlik Community
- :
- All Forums
- :
- QlikView App Dev
- :
- Re: Average of '0' results in dimension not being ...
- Subscribe to RSS Feed
- Mark Topic as New
- Mark Topic as Read
- Float this Topic for Current User
- Bookmark
- Subscribe
- Mute
- Printer Friendly Page
- Mark as New
- Bookmark
- Subscribe
- Mute
- Subscribe to RSS Feed
- Permalink
- Report Inappropriate Content
Average of '0' results in dimension not being displayed
Hi,
Can somebody help me out?
I want to view the average of 'total time' per 'month year' dimension.
Now, this seems to work just fine, except when all the values for a dimension row are 0.
In that case it looks like the dimension row is not displayed at all, while the outcome should be 'the average is of al the 0 rows is 0'.
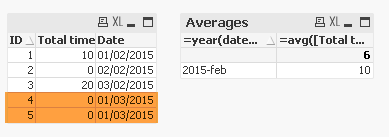
What is displayed is entirely correct, but I want to see the '2015-Mar' with value '0' row as well.
In fact, in the end I want to see this in a graphical chart, but I tried to get the solution first with the tabular chart.
An example attached.
Regards,
Maarten
Accepted Solutions
- Mark as New
- Bookmark
- Subscribe
- Mute
- Subscribe to RSS Feed
- Permalink
- Report Inappropriate Content
- Mark as New
- Bookmark
- Subscribe
- Mute
- Subscribe to RSS Feed
- Permalink
- Report Inappropriate Content
Hi Maarten,
uncheck in tab Grafic
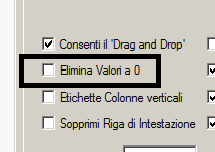
Regards,
Antonio
- Mark as New
- Bookmark
- Subscribe
- Mute
- Subscribe to RSS Feed
- Permalink
- Report Inappropriate Content
Thanks a lot Antonio! That seems to do the job just fine!!
Have a nice day!