Unlock a world of possibilities! Login now and discover the exclusive benefits awaiting you.
- Qlik Community
- :
- All Forums
- :
- QlikView App Dev
- :
- Avg of Calls and Print text objects
- Subscribe to RSS Feed
- Mark Topic as New
- Mark Topic as Read
- Float this Topic for Current User
- Bookmark
- Subscribe
- Mute
- Printer Friendly Page
- Mark as New
- Bookmark
- Subscribe
- Mute
- Subscribe to RSS Feed
- Permalink
- Report Inappropriate Content
Avg of Calls and Print text objects
I would like to do an average of the below but, I'm not getting the correct result.
=Num(Avg({$<EMPLOYEE=,TEAM=p()>} CALLS_ANSWERED),'#,##0')
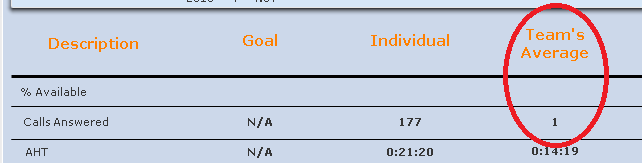
| Description | Individual | Team |
|---|---|---|
| Calls Answered | 2,000 | Avg of the Team |
| Average Handle Time | 22:37 | 25:11 |
Also, i have a couple of text objects to get different call metrics. I would like the capability to have these
text objects printed altogether in a sheet (as seen in the above table). How should i do this? Can you please help? Thank you in advance for your assistance.
- Mark as New
- Bookmark
- Subscribe
- Mute
- Subscribe to RSS Feed
- Permalink
- Report Inappropriate Content
Sounds good, also see here:
Preparing examples for Upload - Reduction and Data Scrambling
- Mark as New
- Bookmark
- Subscribe
- Mute
- Subscribe to RSS Feed
- Permalink
- Report Inappropriate Content
Did you get the file I sent earlier? Here it is again. We are trying to resolve the Team's Avg.
- Mark as New
- Bookmark
- Subscribe
- Mute
- Subscribe to RSS Feed
- Permalink
- Report Inappropriate Content
Checking
- Mark as New
- Bookmark
- Subscribe
- Mute
- Subscribe to RSS Feed
- Permalink
- Report Inappropriate Content
Any luck with it? 🙂
- Mark as New
- Bookmark
- Subscribe
- Mute
- Subscribe to RSS Feed
- Permalink
- Report Inappropriate Content
Where is this chart in your application? If it is not there can you tell me what all were your dimensions and expressions when you created this?
- Mark as New
- Bookmark
- Subscribe
- Mute
- Subscribe to RSS Feed
- Permalink
- Report Inappropriate Content
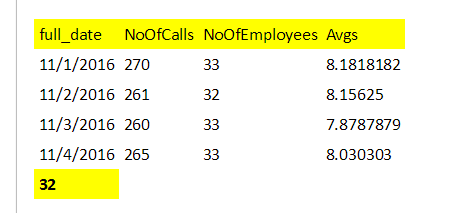
This is the result of a SQL query by our tester. The one in the excel file I sent earlier.
This is what we're trying to replicate for the TEAM's Avg.
- Mark as New
- Bookmark
- Subscribe
- Mute
- Subscribe to RSS Feed
- Permalink
- Report Inappropriate Content
Dimensions are: FULL_DATE, EMPLOYEE_NAME, and WM_TEAM
- Mark as New
- Bookmark
- Subscribe
- Mute
- Subscribe to RSS Feed
- Permalink
- Report Inappropriate Content
I will look at this when I am home
- Mark as New
- Bookmark
- Subscribe
- Mute
- Subscribe to RSS Feed
- Permalink
- Report Inappropriate Content
I appreciate it! Thank you so much!
- Mark as New
- Bookmark
- Subscribe
- Mute
- Subscribe to RSS Feed
- Permalink
- Report Inappropriate Content
Hi Sunny T!
Just for reference in the future, I was able to get the expected result by the following expression:
=sum(all Aggr((Sum( {$<WM_TEAM = p(WM_TEAM),EMPLOYEE_NAME=>} total<DAY_MASTER.FULL_DATE> CALLS.CALLS_ANSWERED)/
Count({$<WM_TEAM = p(WM_TEAM),EMPLOYEE_NAME=>} Total<DAY_MASTER.FULL_DATE> EMPLOYEE_NAME)),DAY_MASTER.FULL_DATE))
This was able to give the sum of the Averages. The only function that we were lacking was the 'ALL'.
Thanks for your kind help!