Unlock a world of possibilities! Login now and discover the exclusive benefits awaiting you.
- Qlik Community
- :
- All Forums
- :
- QlikView App Dev
- :
- Avg of Calls and Print text objects
- Subscribe to RSS Feed
- Mark Topic as New
- Mark Topic as Read
- Float this Topic for Current User
- Bookmark
- Subscribe
- Mute
- Printer Friendly Page
- Mark as New
- Bookmark
- Subscribe
- Mute
- Subscribe to RSS Feed
- Permalink
- Report Inappropriate Content
Avg of Calls and Print text objects
I would like to do an average of the below but, I'm not getting the correct result.
=Num(Avg({$<EMPLOYEE=,TEAM=p()>} CALLS_ANSWERED),'#,##0')
| Description | Individual | Team |
|---|---|---|
| Calls Answered | 2,000 | Avg of the Team |
| Average Handle Time | 22:37 | 25:11 |
Also, i have a couple of text objects to get different call metrics. I would like the capability to have these
text objects printed altogether in a sheet (as seen in the above table). How should i do this? Can you please help? Thank you in advance for your assistance.
- « Previous Replies
- Next Replies »
Accepted Solutions
- Mark as New
- Bookmark
- Subscribe
- Mute
- Subscribe to RSS Feed
- Permalink
- Report Inappropriate Content
I am talking about this number my friend
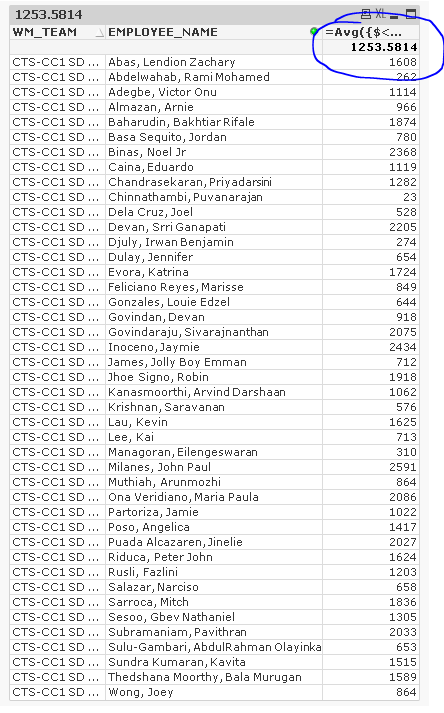
It is the Avg of the sum of calls answered by each of the employees in the whole team.
- Mark as New
- Bookmark
- Subscribe
- Mute
- Subscribe to RSS Feed
- Permalink
- Report Inappropriate Content
Can you share a sample app to look into ?
- Mark as New
- Bookmark
- Subscribe
- Mute
- Subscribe to RSS Feed
- Permalink
- Report Inappropriate Content
How is your raw data look like? what is your expected output?
- Mark as New
- Bookmark
- Subscribe
- Mute
- Subscribe to RSS Feed
- Permalink
- Report Inappropriate Content
Hi! Sorry for the delayed response but, what you see above is the expected output. I have metrics description on the left hand side of the table, then the output per individual based on what's selected from the filter and then the Team output which is the Avg.
- Mark as New
- Bookmark
- Subscribe
- Mute
- Subscribe to RSS Feed
- Permalink
- Report Inappropriate Content
Raw data?
- Mark as New
- Bookmark
- Subscribe
- Mute
- Subscribe to RSS Feed
- Permalink
- Report Inappropriate Content
Load * inline [
EMPLOYEE, Mgr, COUNTRY, TEAM, CALLS_ANSWERED
Samat, Fad, KL, SUPP SPEC, 7
Abas, Zach, KL, SUPP SPEC, 15
Abas, Zach, KL, SUPP SPEC, 3
Abas, Zach, KL, SUPP SPEC, 4
Abas, Zach, KL, SUPP SPEC, 6
Abas, Zach, KL, SUPP SPEC, 1
Abas, Zach, KL, SUPP SPEC, 2
Abas, Zach, KL, SUPP SPEC, 3
Abas, Zach, KL, SUPP SPEC, 4
Abas, Zach, KL, SUPP SPEC, 5
Abas, Zach, KL, SUPP SPEC, 6
Abas, Zach, KL, SUPP SPEC, 7
Abas, Zach, KL, SUPP SPEC, 9
Abas, Zach, KL, SUPP SPEC, 10
Abas, Zach, KL, SUPP SPEC, 17
Abas, Zach, KL, SUPP SPEC, 5
Abdel, Remi, KL, SUPP SPEC, 0
Abdel, Remi, KL, SUPP SPEC, 1
Abdel, Remi, KL, SUPP SPEC, 2
Abdel, Remi, KL, SUPP SPEC, 3
Abdel, Remi, KL, SUPP SPEC, 4
Abdel, Remi, KL, SUPP SPEC, 6
];
- Mark as New
- Bookmark
- Subscribe
- Mute
- Subscribe to RSS Feed
- Permalink
- Report Inappropriate Content
Output should be like below:
| SUM PER INDIVIDUAL | |
| Row Labels | Sum of CALLS_ANSWERED |
| Abas, | 97 |
| Abdel, | 16 |
| Samat, | 7 |
| Grand Total | 120 |
| AVG OF TEAM | |
| Row Labels | Average of CALLS_ANSWERED |
| SUPP SPEC, | 5 |
| Grand Total | 5 |
- Mark as New
- Bookmark
- Subscribe
- Mute
- Subscribe to RSS Feed
- Permalink
- Report Inappropriate Content
Is this you are looking for ?
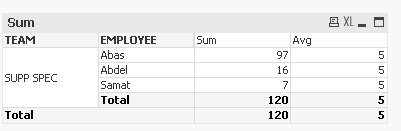
Pivot table used
Dim: Team
Employee
Expr1: Sum(CALLS_ANSWERED)
Expr2: Avg(TOTAL CALLS_ANSWERED)
- Mark as New
- Bookmark
- Subscribe
- Mute
- Subscribe to RSS Feed
- Permalink
- Report Inappropriate Content
Yes, the output you've given is what I'm expecting. However, how will I apply it to my expression below? I added the Total after the AVG and it's not giving the right output.
=Num(Avg({$<EMPLOYEE=,TEAM=p()>} CALLS_ANSWERED),'#,##0')
- Mark as New
- Bookmark
- Subscribe
- Mute
- Subscribe to RSS Feed
- Permalink
- Report Inappropriate Content
What is your output you are expecting for this expression ?
- « Previous Replies
- Next Replies »