Unlock a world of possibilities! Login now and discover the exclusive benefits awaiting you.
- Qlik Community
- :
- All Forums
- :
- QlikView App Dev
- :
- Re: Bar Chart Help
- Subscribe to RSS Feed
- Mark Topic as New
- Mark Topic as Read
- Float this Topic for Current User
- Bookmark
- Subscribe
- Mute
- Printer Friendly Page
- Mark as New
- Bookmark
- Subscribe
- Mute
- Subscribe to RSS Feed
- Permalink
- Report Inappropriate Content
Bar Chart Help
Hi guys,
I have a bar chart that I'm looking to show our top 10 suppliers on.
I should have 10 suppliers all showing as 100% (as defined by a score expression), so to then order them correctly I would do a sort on the amount of Spend.
However, it's not bringing them back in the order I would expect.
What should I specifically do to achieve this? I've tried all manner of sorts, expression limits, etc.
Many thanks,
Gareth
- « Previous Replies
- Next Replies »
- Mark as New
- Bookmark
- Subscribe
- Mute
- Subscribe to RSS Feed
- Permalink
- Report Inappropriate Content
May be sort them using a sort expression
Sum(Spend) in descending order
- Mark as New
- Bookmark
- Subscribe
- Mute
- Subscribe to RSS Feed
- Permalink
- Report Inappropriate Content
How would I do this Sunny?
I need it to sort by score then by spend. Nothing I have tried has worked.
Thanks,
- Mark as New
- Bookmark
- Subscribe
- Mute
- Subscribe to RSS Feed
- Permalink
- Report Inappropriate Content
To make it easier to provide a working solution, please post an example document with representative data and bar chart.
- Mark as New
- Bookmark
- Subscribe
- Mute
- Subscribe to RSS Feed
- Permalink
- Report Inappropriate Content
Hi Gareth,
right click on chart properties-->sort tab--.>select the expression and see enable expression option on the left side and write sum(spend) in that
Regard
Om
- Mark as New
- Bookmark
- Subscribe
- Mute
- Subscribe to RSS Feed
- Permalink
- Report Inappropriate Content
Hi Gareth,
Please find the sample app attached and let me know if that is as expected output.
Regards,
Rasly.K
- Mark as New
- Bookmark
- Subscribe
- Mute
- Subscribe to RSS Feed
- Permalink
- Report Inappropriate Content
Hi Rasly,
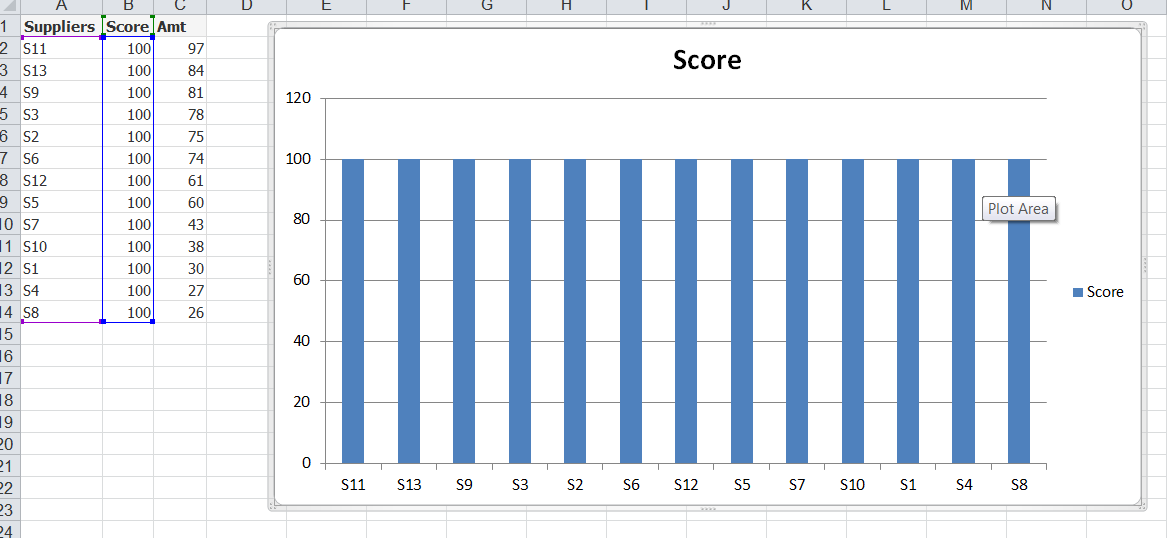
Close! When I sort the table so S11 is at the top (due to having highest amount among those who scored 100), it doesn't appear unless I turn off the Dimension limit.
The chart below is what I'm trying to achieve - based on your example.

Thanks for your help.
Gareth
- Mark as New
- Bookmark
- Subscribe
- Mute
- Subscribe to RSS Feed
- Permalink
- Report Inappropriate Content
Hi Peter
Please see attached example files.
Thanks,
Gareth
- Mark as New
- Bookmark
- Subscribe
- Mute
- Subscribe to RSS Feed
- Permalink
- Report Inappropriate Content
Thanks Omkar,
Unfortunately it didn't work.
Thanks,
Gareth
- Mark as New
- Bookmark
- Subscribe
- Mute
- Subscribe to RSS Feed
- Permalink
- Report Inappropriate Content
- « Previous Replies
- Next Replies »