Unlock a world of possibilities! Login now and discover the exclusive benefits awaiting you.
- Qlik Community
- :
- All Forums
- :
- QlikView App Dev
- :
- Re: Bar Chart with columns table
- Subscribe to RSS Feed
- Mark Topic as New
- Mark Topic as Read
- Float this Topic for Current User
- Bookmark
- Subscribe
- Mute
- Printer Friendly Page
- Mark as New
- Bookmark
- Subscribe
- Mute
- Subscribe to RSS Feed
- Permalink
- Report Inappropriate Content
Bar Chart with columns table
Hi i am in this situation: i have a table with those columns:
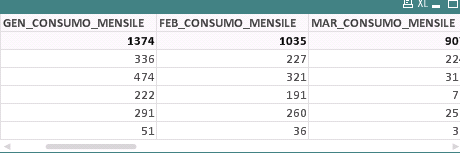
gen_consumo_mensile,feb_consumo_mensile, mar_consumo_mensile,apr_consumo_mensile,mag_consumo_mensile,giu_consumo_mensile, lug_consumo_mensile, ago_consumo_mensile, set_consumo_mensile, ott_consumo_mensile,nov_consumo_mensile,dic_consumo_mensile
Are 12 columns
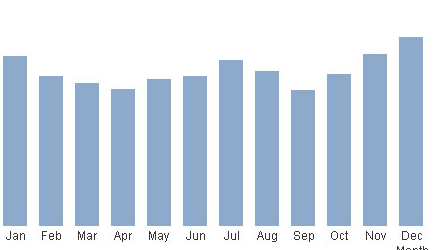
I want to make a bar chart with, in the dimension i have months (gen,feb, mar,apr,may, jun,jul,ago,sep,oct,nov,dec) and in the bar the sum of those columns (for JAN i want the sum of GEN_CONSUMO_MENSILE, for FEB i want the sum of FEB_CONSUMO_MENSILE, for MAR i want the sum of MAR_CONSUMO_MENSILE.... and so on till for DEC the sum of DIC_CONSUMO_MENSILE.
How can i do that?
- « Previous Replies
- Next Replies »
Accepted Solutions
- Mark as New
- Bookmark
- Subscribe
- Mute
- Subscribe to RSS Feed
- Permalink
- Report Inappropriate Content
try this:
expression:
if(ValueList('Jan','Feb','Mar','Apr','May','Jun','Jly','Aug','Sep','Oct','Nov','Dec')= 'Jan',/*sum(GEN_CONSUMO_MENSILE)*/Sum({<D_FINE_VAL={"=D_FINE_VAL>D_FINE_FORN"}>}GEN_CONSUMO_MENSILE),
if(ValueList('Jan','Feb','Mar','Apr','May','Jun','Jly','Aug','Sep','Oct','Nov','Dec')= 'Feb',Sum({<D_FINE_VAL={"=D_FINE_VAL>D_FINE_FORN"}>}FEB_CONSUMO_MENSILE),
if(ValueList('Jan','Feb','Mar','Apr','May','Jun','Jly','Aug','Sep','Oct','Nov','Dec')= 'Mar',Sum({<D_FINE_VAL={"=D_FINE_VAL>D_FINE_FORN"}>}MAR_CONSUMO_MENSILE),
if(ValueList('Jan','Feb','Mar','Apr','May','Jun','Jly','Aug','Sep','Oct','Nov','Dec')= 'Apr',Sum({<D_FINE_VAL={"=D_FINE_VAL>D_FINE_FORN"}>}APR_CONSUMO_MENSILE),
if(ValueList('Jan','Feb','Mar','Apr','May','Jun','Jly','Aug','Sep','Oct','Nov','Dec')= 'May',Sum({<D_FINE_VAL={"=D_FINE_VAL>D_FINE_FORN"}>}MAG_CONSUMO_MENSILE),
if(ValueList('Jan','Feb','Mar','Apr','May','Jun','Jly','Aug','Sep','Oct','Nov','Dec')= 'Jun',Sum({<D_FINE_VAL={"=D_FINE_VAL>D_FINE_FORN"}>}GIU_CONSUMO_MENSILE),
if(ValueList('Jan','Feb','Mar','Apr','May','Jun','Jly','Aug','Sep','Oct','Nov','Dec')= 'Jly',Sum({<D_FINE_VAL={"=D_FINE_VAL>D_FINE_FORN"}>}LUG_CONSUMO_MENSILE),
if(ValueList('Jan','Feb','Mar','Apr','May','Jun','Jly','Aug','Sep','Oct','Nov','Dec')= 'Aug',Sum({<D_FINE_VAL={"=D_FINE_VAL>D_FINE_FORN"}>}AGO_CONSUMO_MENSILE),
if(ValueList('Jan','Feb','Mar','Apr','May','Jun','Jly','Aug','Sep','Oct','Nov','Dec')= 'Sep',Sum({<D_FINE_VAL={"=D_FINE_VAL>D_FINE_FORN"}>}SET_CONSUMO_MENSILE),
if(ValueList('Jan','Feb','Mar','Apr','May','Jun','Jly','Aug','Sep','Oct','Nov','Dec')= 'Oct',Sum({<D_FINE_VAL={"=D_FINE_VAL>D_FINE_FORN"}>}OTT_CONSUMO_MENSILE),
if(ValueList('Jan','Feb','Mar','Apr','May','Jun','Jly','Aug','Sep','Oct','Nov','Dec')= 'Nov',Sum({<D_FINE_VAL={"=D_FINE_VAL>D_FINE_FORN"}>}NOV_CONSUMO_MENSILE),
if(ValueList('Jan','Feb','Mar','Apr','May','Jun','Jly','Aug','Sep','Oct','Nov','Dec')= 'Dec',Sum({<D_FINE_VAL={"=D_FINE_VAL>D_FINE_FORN"}>}DIC_CONSUMO_MENSILE)
))))))))))))
- Mark as New
- Bookmark
- Subscribe
- Mute
- Subscribe to RSS Feed
- Permalink
- Report Inappropriate Content
can you please attach the sample data.
- Mark as New
- Bookmark
- Subscribe
- Mute
- Subscribe to RSS Feed
- Permalink
- Report Inappropriate Content
Hi Daniele,
if your data is not too large, I think you can use crosstable() directly. Please see my attachment.
Thank.
Aiolos
- Mark as New
- Bookmark
- Subscribe
- Mute
- Subscribe to RSS Feed
- Permalink
- Report Inappropriate Content
Hi Sage, thanks for the reply,... but i think is not the solution for me... i have a table with those field GEN_CONSUMO_MENSILE ETC.... that change when i select an Year and a Month in my visualization.
how can i do a bar chart in this way with those columns?
- Mark as New
- Bookmark
- Subscribe
- Mute
- Subscribe to RSS Feed
- Permalink
- Report Inappropriate Content
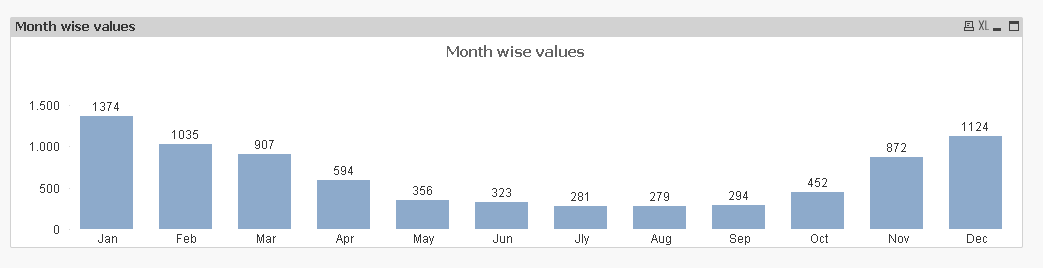
This is a sample data where you can do it, thanks
- Mark as New
- Bookmark
- Subscribe
- Mute
- Subscribe to RSS Feed
- Permalink
- Report Inappropriate Content
i need to do with this example so you can understand me
- Mark as New
- Bookmark
- Subscribe
- Mute
- Subscribe to RSS Feed
- Permalink
- Report Inappropriate Content
is impossible to do what i asked?
- Mark as New
- Bookmark
- Subscribe
- Mute
- Subscribe to RSS Feed
- Permalink
- Report Inappropriate Content
Hi Daniele,
Sorry to reply late, could you please try to use below script to load again?
CONTR_Gas:
LOAD
"FORNITORE",
"COD_CLIENTE",
"RAGIONE_SOCIALE",
PR_SEDE_LEGALE,
"DES_PR_CLI",
DES_REGIONE_CLI,
"COD_ATECO",
DESCINT_ATECO,
COD_PUNTO,
"CD_TP_PUNTO",
"ID_FORNITURA",
"PDR",
PR_PDR,
"DES_PR_PDR",
DES_REGIONE_PDR,
"COD_CONTRATTO",
"PRODOTTO",
"GAMMA_PRODOTTO",
"COD_AGENZIA",
"CANALE",
"REFERENTE",
"AGENZIA_PADRE",
"AGENZIA",
"AGENTE",
"D_FIRMA",
"D_INIZ_FORN",
"D_FINE_FORN",
"D_INIZ_VAL",
"D_FINE_VAL",
"ANNOINIVAL",
"ANNOFINEVAL",
"MESEINIVAL",
"MESEFINEVAL",
"ANNOINIFORN",
"ANNOFINEFORN",
"MESEINIFORN",
"MESEFINEFORN",
"CONSUMO_TOT_ANNUO",
"MESEFINEVAL_MENOUNO",
"GEN_CONSUMO_MENSILE",
"FEB_CONSUMO_MENSILE",
"MAR_CONSUMO_MENSILE",
"APR_CONSUMO_MENSILE",
"MAG_CONSUMO_MENSILE",
"GIU_CONSUMO_MENSILE",
"LUG_CONSUMO_MENSILE",
"AGO_CONSUMO_MENSILE",
"SET_CONSUMO_MENSILE",
"OTT_CONSUMO_MENSILE",
"NOV_CONSUMO_MENSILE",
"DIC_CONSUMO_MENSILE"
from 'contra.qvd' (qvd);
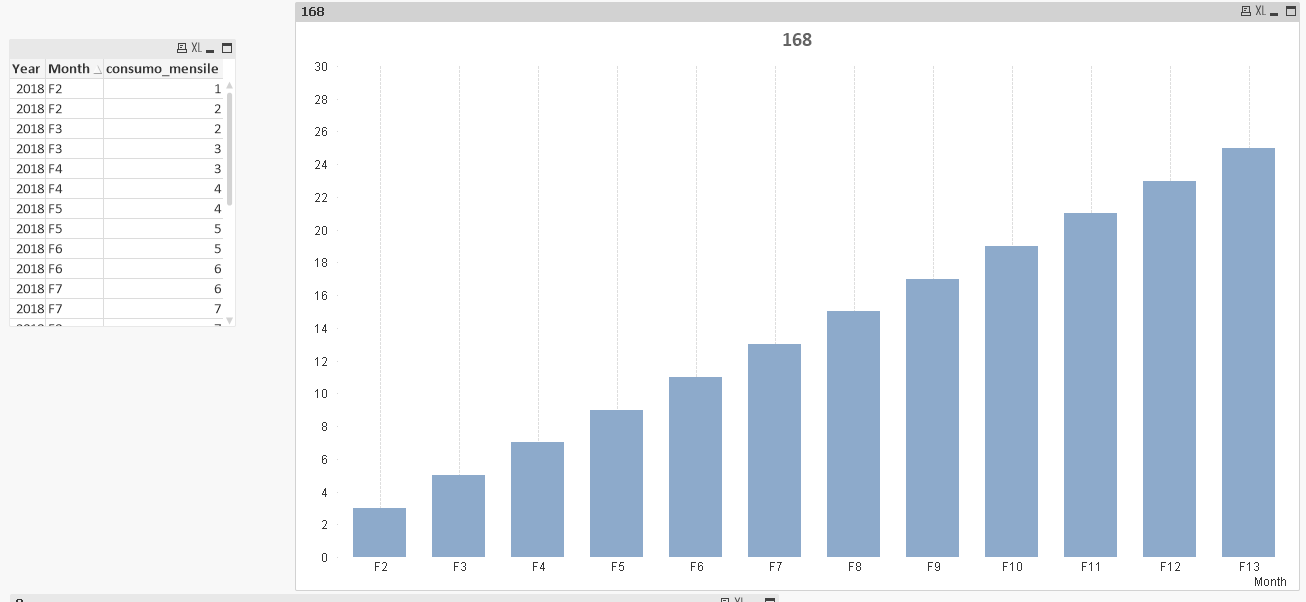
CrossTable(Month,consumo_mensile,39)
LOAD * Resident CONTR_Gas;
Thanks.
Aiolos
- Mark as New
- Bookmark
- Subscribe
- Mute
- Subscribe to RSS Feed
- Permalink
- Report Inappropriate Content
can you use the example and doing the bar chart with your specifications?, becouse, or i wrong something or i can't load the script
- Mark as New
- Bookmark
- Subscribe
- Mute
- Subscribe to RSS Feed
- Permalink
- Report Inappropriate Content
Please see the attachment.
Aiolos
- « Previous Replies
- Next Replies »