Unlock a world of possibilities! Login now and discover the exclusive benefits awaiting you.
- Qlik Community
- :
- All Forums
- :
- QlikView App Dev
- :
- Bar Chart
- Subscribe to RSS Feed
- Mark Topic as New
- Mark Topic as Read
- Float this Topic for Current User
- Bookmark
- Subscribe
- Mute
- Printer Friendly Page
- Mark as New
- Bookmark
- Subscribe
- Mute
- Subscribe to RSS Feed
- Permalink
- Report Inappropriate Content
Bar Chart
Hi Friends
In my QV document have following data
| DESCRIPTION | ACTUAL |
| GROSS_PREMIUM | 3,000,000 |
| CEDED | 630,000 |
| NET_CLAIMS | 1,200,000 |
| COMM | 200,000 |
| EXPENSES | 500,000 |
| NET_PROFIT | 470,000 |
I want to show in a single bar of bar chart with representing % of CEDED.NET_CLAIMS,COMM,EXPENSES,NET_PROFIT as against GROSS_PREMIUM
I have written under mentioned expression for but it is not working. Kindly help me to correct it
SUM({<DESCRIPTION={CEDED_PREMIUM,NET_CLAIMS,COMM,EXPENSES,NET_PROFIT}>}ACTUAL)/SUM({TOTAL DESCRIPTION=<'GROSS_PREMIUM'>ACTUAL)
Accepted Solutions
- Mark as New
- Bookmark
- Subscribe
- Mute
- Subscribe to RSS Feed
- Permalink
- Report Inappropriate Content
Or
Just Sum..
SUM({<DESCRIPTION = {'CEDED','NET_CLAIMS','COMM','EXPENSES','NET_PROFIT'}>}ACTUAL)
Then,
Tick the "Relative" Option in Expression Tab
And Number Tab -> Fixed to - 2 -> Tick the Show in Percent(%)
Edit:
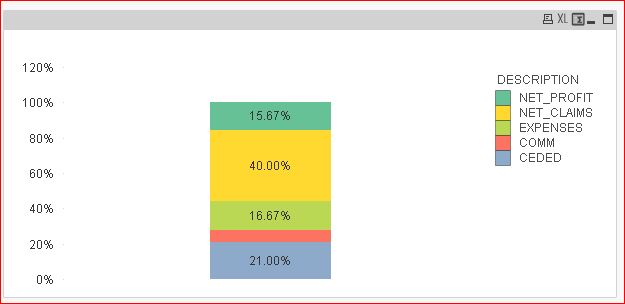
Like the Below screen shot?
- Mark as New
- Bookmark
- Subscribe
- Mute
- Subscribe to RSS Feed
- Permalink
- Report Inappropriate Content
SUM({<DESCRIPTION = {'CEDED','NET_CLAIMS','COMM','EXPENSES','NET_PROFIT'}>}ACTUAL)
/
SUM(TOTAL {1<DESCRIPTION = {'GROSS_PREMIUM'}>}ACTUAL)
- Mark as New
- Bookmark
- Subscribe
- Mute
- Subscribe to RSS Feed
- Permalink
- Report Inappropriate Content
Not sure, but may be one of these
SUM({<DESCRIPTION={'CEDED_PREMIUM', 'NET_CLAIMS', 'COMM', 'EXPENSES', 'NET_PROFIT'}>} ACTUAL) /SUM({<DESCRIPTION = {'GROSS_PREMIUM'}>} ACTUAL)
or
SUM(TOTAL {<DESCRIPTION={'CEDED_PREMIUM', 'NET_CLAIMS', 'COMM', 'EXPENSES', 'NET_PROFIT'}>} ACTUAL) /SUM(TOTAL {<DESCRIPTION = {'GROSS_PREMIUM'}>} ACTUAL)
- Mark as New
- Bookmark
- Subscribe
- Mute
- Subscribe to RSS Feed
- Permalink
- Report Inappropriate Content
Or
Just Sum..
SUM({<DESCRIPTION = {'CEDED','NET_CLAIMS','COMM','EXPENSES','NET_PROFIT'}>}ACTUAL)
Then,
Tick the "Relative" Option in Expression Tab
And Number Tab -> Fixed to - 2 -> Tick the Show in Percent(%)
Edit:
Like the Below screen shot?
- Mark as New
- Bookmark
- Subscribe
- Mute
- Subscribe to RSS Feed
- Permalink
- Report Inappropriate Content
Thanks all
But none of the options work
Only a single Bar Appears with 100% shown
- Mark as New
- Bookmark
- Subscribe
- Mute
- Subscribe to RSS Feed
- Permalink
- Report Inappropriate Content
I guess what I am confused about is that the values you have shown above are aggregated values or do they repeat over certain dimension or is that the only data within that table? I am having difficulty understanding the data model here. Would you be able to provide a sample or give some clarification?
- Mark as New
- Bookmark
- Subscribe
- Mute
- Subscribe to RSS Feed
- Permalink
- Report Inappropriate Content
Hi,
Find the attached result.
Regards,
Kaushik Solanki
- Mark as New
- Bookmark
- Subscribe
- Mute
- Subscribe to RSS Feed
- Permalink
- Report Inappropriate Content
You have to use DESCRIPTION as dimension of bar chart
- Mark as New
- Bookmark
- Subscribe
- Mute
- Subscribe to RSS Feed
- Permalink
- Report Inappropriate Content
Your Chart is only a single bar and no % is for individually
What I want single horizontal bar representing how GROSS PREMIUM is divided into following items
| CEDED 21% NET_CLAIM 40% COMM 7% EXPENSES 17% NET_PROFIT 16% |
- Mark as New
- Bookmark
- Subscribe
- Mute
- Subscribe to RSS Feed
- Permalink
- Report Inappropriate Content
PFA