Unlock a world of possibilities! Login now and discover the exclusive benefits awaiting you.
Announcements
Save $650 on Qlik Connect, Dec 1 - 7, our lowest price of the year. Register with code CYBERWEEK: Register
- Qlik Community
- :
- All Forums
- :
- QlikView App Dev
- :
- Re: Bar chart doesn't match table ?
Options
- Subscribe to RSS Feed
- Mark Topic as New
- Mark Topic as Read
- Float this Topic for Current User
- Bookmark
- Subscribe
- Mute
- Printer Friendly Page
Turn on suggestions
Auto-suggest helps you quickly narrow down your search results by suggesting possible matches as you type.
Showing results for
Not applicable
2016-08-01
10:29 PM
- Mark as New
- Bookmark
- Subscribe
- Mute
- Subscribe to RSS Feed
- Permalink
- Report Inappropriate Content
Bar chart doesn't match table ?
see attached qvw
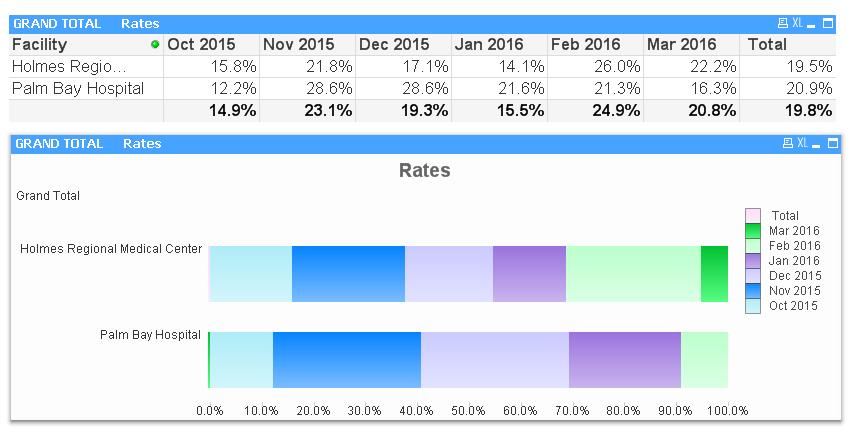
How do I make the bar chart visualization match the table up above ?
555 Views
1 Solution
Accepted Solutions
Master II
2016-08-02
02:14 PM
- Mark as New
- Bookmark
- Subscribe
- Mute
- Subscribe to RSS Feed
- Permalink
- Report Inappropriate Content
3 Replies
MVP
2016-08-02
12:37 PM
- Mark as New
- Bookmark
- Subscribe
- Mute
- Subscribe to RSS Feed
- Permalink
- Report Inappropriate Content
The numbers seems to be matching. What is that you are looking to get?
412 Views
Not applicable
2016-08-02
01:32 PM
Author
- Mark as New
- Bookmark
- Subscribe
- Mute
- Subscribe to RSS Feed
- Permalink
- Report Inappropriate Content
The minor details tweaked on bar chart
- title should not be Oct 2015 but say RATES
on X- axis - I want 0 - maybe 100 not 150
when I scroll over bar - it keeps showing values for OCT or MAR - why does it do this ?
Just edit the minor details to match all the metric names on the table chart above.
412 Views
Master II
2016-08-02
02:14 PM
- Mark as New
- Bookmark
- Subscribe
- Mute
- Subscribe to RSS Feed
- Permalink
- Report Inappropriate Content
Please see the attached file which is reflecting what you need:
