Unlock a world of possibilities! Login now and discover the exclusive benefits awaiting you.
- Qlik Community
- :
- All Forums
- :
- QlikView App Dev
- :
- Re: Bar chart - formatting question
- Subscribe to RSS Feed
- Mark Topic as New
- Mark Topic as Read
- Float this Topic for Current User
- Bookmark
- Subscribe
- Mute
- Printer Friendly Page
- Mark as New
- Bookmark
- Subscribe
- Mute
- Subscribe to RSS Feed
- Permalink
- Report Inappropriate Content
Bar chart - formatting question
Hi,
I am looking at a Bar Chart that was created by another developer. Here's a screenshot.
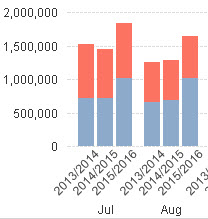
I pretty much have compared every setting between my version and the one created by someone else and I don't see any
difference. But I can't multiple years to group together like they had it. In the above, when the app is first loaded without making any selection, the bar chart shows the last highest 3 years for Jul, Aug, Sept and etc.. The expression is coded as max(year), max(year)-1
and max(year)-2. When I do the same on my version, it only shows one year at a time. For example: 2016 Jul, 2016 Aug and etc. Then when I make a selection on Year 2015, it will show 2015 Jul, 2015 Aug and etc.
What am I missing or how do you make it so it will look like the above?
Thank you
- « Previous Replies
-
- 1
- 2
- Next Replies »
Accepted Solutions
- Mark as New
- Bookmark
- Subscribe
- Mute
- Subscribe to RSS Feed
- Permalink
- Report Inappropriate Content
Finally figured out !!
This expression doesn't work
= -1 * SUM( {
1
<
FiscalYear={$(=max(FiscalYear)), $(=max(FiscalYear)-1)},
Location={'EAST'}
>
}
Total
)
However this works. It seems the bar chart needs 3 sets of years. Can you guys confirm this with me?
Everyday is a learning day for me.
= -1 * SUM( {
1
<
FiscalYear={$(=max(FiscalYear)), $(=max(FiscalYear)-1), $(=max(FiscalYear)-2)},
Location={'EAST'}
>
}
Total
)
- Mark as New
- Bookmark
- Subscribe
- Mute
- Subscribe to RSS Feed
- Permalink
- Report Inappropriate Content
Meant to say "But I can't get multiple years to group together like they had it"
- Mark as New
- Bookmark
- Subscribe
- Mute
- Subscribe to RSS Feed
- Permalink
- Report Inappropriate Content
Would you be able to share a sample?
- Mark as New
- Bookmark
- Subscribe
- Mute
- Subscribe to RSS Feed
- Permalink
- Report Inappropriate Content
Sunny,
Unfortunately I won't be able to as it contains company data. Would you be able to create a quick prototype to mirror the above and perhaps walk me through the key properties or configuration??
- Mark as New
- Bookmark
- Subscribe
- Mute
- Subscribe to RSS Feed
- Permalink
- Report Inappropriate Content
I wish I had time to do that... but I hope someone else might be able to help you out here 
- Mark as New
- Bookmark
- Subscribe
- Mute
- Subscribe to RSS Feed
- Permalink
- Report Inappropriate Content
Also I tried to copy this bar chart over to my QVW file. However it is not copying. I did a "copy to clipboard - object" and on my qvw, I did a "past sheet object" but I don't see it. Is there a trick to this?
- Mark as New
- Bookmark
- Subscribe
- Mute
- Subscribe to RSS Feed
- Permalink
- Report Inappropriate Content
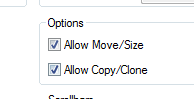
There may be a show/hide condition for this chart. Look for a hidden chart through sheet properties and the disable any show/hide conditions on the layout tab
- Mark as New
- Bookmark
- Subscribe
- Mute
- Subscribe to RSS Feed
- Permalink
- Report Inappropriate Content
or you can just disable any show/hide condition before you copy and paste this chart
- Mark as New
- Bookmark
- Subscribe
- Mute
- Subscribe to RSS Feed
- Permalink
- Report Inappropriate Content
this might be because the copy is not allowed
- Mark as New
- Bookmark
- Subscribe
- Mute
- Subscribe to RSS Feed
- Permalink
- Report Inappropriate Content
You are correct. There was a condition in the Layout. I changed it to "Always" and was able to copy it. Then I replaced the original expressions with mine and the chart still shows one year at a time. So it does not appear to be
chart settings. I can't image is the expression either. Can it?? My expressions are slightly different in terms of the criteria within the SUM( {1 <>} Total) and the differences are within the <> which is really the WHERE clause in SQL.
- « Previous Replies
-
- 1
- 2
- Next Replies »