Unlock a world of possibilities! Login now and discover the exclusive benefits awaiting you.
Announcements
Introducing Qlik Answers: A plug-and-play, Generative AI powered RAG solution.
READ ALL ABOUT IT!
- Qlik Community
- :
- All Forums
- :
- QlikView App Dev
- :
- Re: Bar chart with difference in result
Options
- Subscribe to RSS Feed
- Mark Topic as New
- Mark Topic as Read
- Float this Topic for Current User
- Bookmark
- Subscribe
- Mute
- Printer Friendly Page
Turn on suggestions
Auto-suggest helps you quickly narrow down your search results by suggesting possible matches as you type.
Showing results for
Creator II
2015-06-28
08:19 AM
- Mark as New
- Bookmark
- Subscribe
- Mute
- Subscribe to RSS Feed
- Permalink
- Report Inappropriate Content
Bar chart with difference in result
hi
i have a table like below
| Year | Value |
|---|---|
| 2010 | 10 |
| 2011 | 15 |
| 2012 | 5 |
| 2013 | 8 |
| 2014 | 7 |
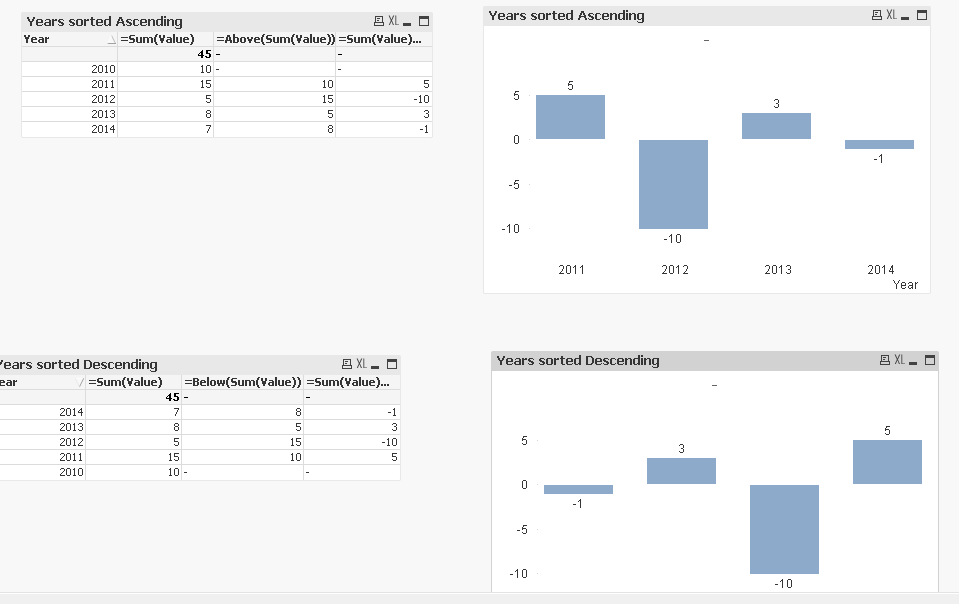
i need to have a bar chart with dimension of year and difference of values of two year
it means like this:
| year | new value (value of current year - value of past year) |
|---|---|
| 2014 | -1 |
| 2013 | 3 |
| 2012 | -10 |
| 2011 | 5 |
what should i do in qlikview to have this chart?
- Tags:
- chart
- expression
510 Views
1 Solution
Accepted Solutions
MVP
2015-06-28
08:47 AM
- Mark as New
- Bookmark
- Subscribe
- Mute
- Subscribe to RSS Feed
- Permalink
- Report Inappropriate Content
Here is a sample qvw prepared from the data you gave and expression swuehl suggested.
344 Views
5 Replies
MVP
2015-06-28
08:29 AM
- Mark as New
- Bookmark
- Subscribe
- Mute
- Subscribe to RSS Feed
- Permalink
- Report Inappropriate Content
Try chart inter record functions, like below() or above() (depending on sort order of Year dimension):
=sum(Value) - below(sum(Value))
MVP
2015-06-28
08:47 AM
- Mark as New
- Bookmark
- Subscribe
- Mute
- Subscribe to RSS Feed
- Permalink
- Report Inappropriate Content
Here is a sample qvw prepared from the data you gave and expression swuehl suggested.
345 Views
Creator II
2015-06-28
11:01 AM
Author
- Mark as New
- Bookmark
- Subscribe
- Mute
- Subscribe to RSS Feed
- Permalink
- Report Inappropriate Content
thank you
344 Views
Creator II
2015-06-28
11:01 AM
Author
- Mark as New
- Bookmark
- Subscribe
- Mute
- Subscribe to RSS Feed
- Permalink
- Report Inappropriate Content
thank you
344 Views
MVP
2015-06-28
11:52 AM
- Mark as New
- Bookmark
- Subscribe
- Mute
- Subscribe to RSS Feed
- Permalink
- Report Inappropriate Content
No problem 
Glad we were able to help.
Best,
Sunny
344 Views