Unlock a world of possibilities! Login now and discover the exclusive benefits awaiting you.
- Qlik Community
- :
- All Forums
- :
- QlikView App Dev
- :
- Re: Bar chart with overlaped bar
- Subscribe to RSS Feed
- Mark Topic as New
- Mark Topic as Read
- Float this Topic for Current User
- Bookmark
- Subscribe
- Mute
- Printer Friendly Page
- Mark as New
- Bookmark
- Subscribe
- Mute
- Subscribe to RSS Feed
- Permalink
- Report Inappropriate Content
Bar chart with overlaped bar
Hello,
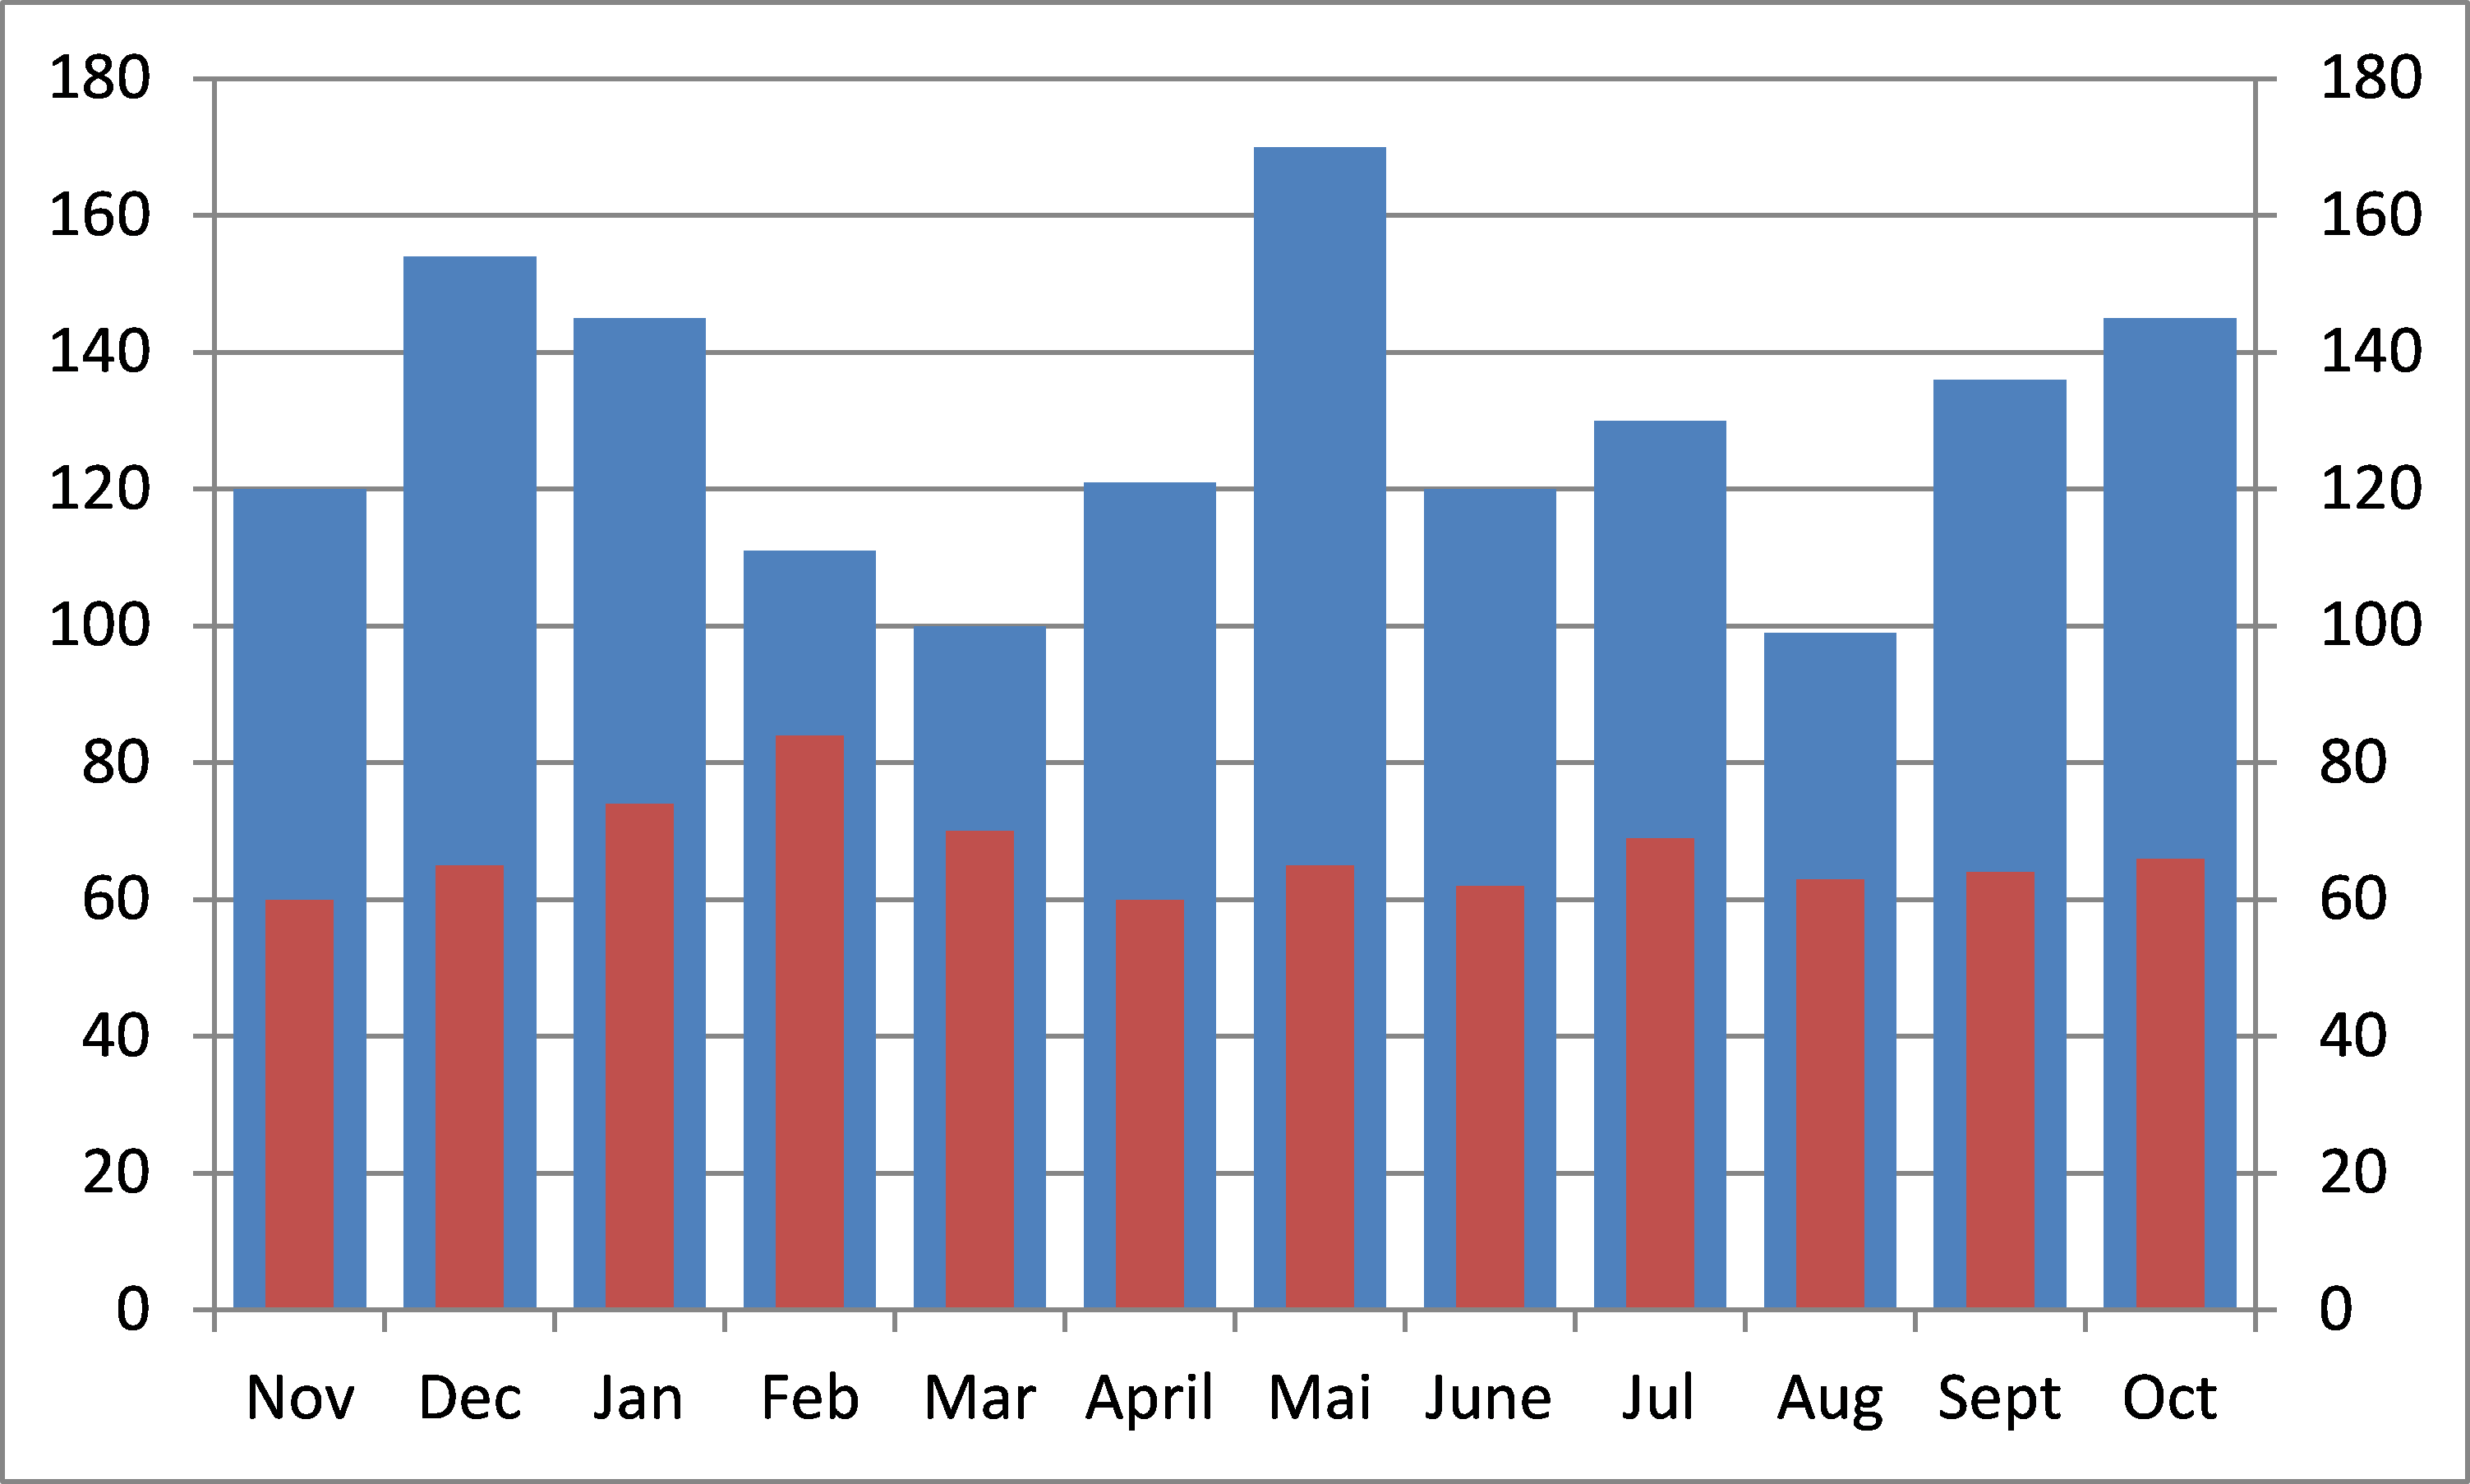
Do you know if it's possible to do this kind of graph ? (with for each month, 2 différents expressions at the same place but with different bar witdh)

Many thanks in advance
- Mark as New
- Bookmark
- Subscribe
- Mute
- Subscribe to RSS Feed
- Permalink
- Report Inappropriate Content
Feel free to use my name with it ![]()
- Mark as New
- Bookmark
- Subscribe
- Mute
- Subscribe to RSS Feed
- Permalink
- Report Inappropriate Content
Will do. ![]() Thank you again.
Thank you again.
- Mark as New
- Bookmark
- Subscribe
- Mute
- Subscribe to RSS Feed
- Permalink
- Report Inappropriate Content
It does. I may respond again with a twist, but not any time soon.
- Mark as New
- Bookmark
- Subscribe
- Mute
- Subscribe to RSS Feed
- Permalink
- Report Inappropriate Content
This is beautiful marcowedel
- Mark as New
- Bookmark
- Subscribe
- Mute
- Subscribe to RSS Feed
- Permalink
- Report Inappropriate Content
Superb marcowedel
- Mark as New
- Bookmark
- Subscribe
- Mute
- Subscribe to RSS Feed
- Permalink
- Report Inappropriate Content

Amazing ... If you have time, Please release QS version too..
- Mark as New
- Bookmark
- Subscribe
- Mute
- Subscribe to RSS Feed
- Permalink
- Report Inappropriate Content
Its Great Marco, first time i ever seen this.
- Mark as New
- Bookmark
- Subscribe
- Mute
- Subscribe to RSS Feed
- Permalink
- Report Inappropriate Content
Not sure if this addresses what you are looking for in Sense, but a simple way to show stacked bars that *look like* they overlap is to make the value of the rear measure equal to itself minus the fore measure.
For example, you want to show Budget and Actual:
Rear measure would be: Sum(Budget) - Sum(Actual)
Fore measure is: Sum(Actual)
That way the amount that Budget excedes Actual by is what is visible above Actual. Obviously you see no Budget if it is smaller than Actual; if you really need to see both at all times, hopefully Marco's solution is adaptable.
- Mark as New
- Bookmark
- Subscribe
- Mute
- Subscribe to RSS Feed
- Permalink
- Report Inappropriate Content
marcowedel Really like and appropriate your work.
Nice solution to compare target vs actual using this method in bar chart. I am actually using this for one of my project.
May be I am thinking or asking little more, but is there any way we can show data on top of bar chart as well?
I am sure you will come back with a solution.
- Mark as New
- Bookmark
- Subscribe
- Mute
- Subscribe to RSS Feed
- Permalink
- Report Inappropriate Content
Hi,
is this what you had in mind?
regards
Marco