Unlock a world of possibilities! Login now and discover the exclusive benefits awaiting you.
- Qlik Community
- :
- All Forums
- :
- QlikView App Dev
- :
- Re: Block Chart Subtotal Aggregation Type?
- Subscribe to RSS Feed
- Mark Topic as New
- Mark Topic as Read
- Float this Topic for Current User
- Bookmark
- Subscribe
- Mute
- Printer Friendly Page
- Mark as New
- Bookmark
- Subscribe
- Mute
- Subscribe to RSS Feed
- Permalink
- Report Inappropriate Content
Block Chart Subtotal Aggregation Type?
Is it possible to change the aggregation type for the header row of the block chart when you have 2 dimensions? Right now it looks like its just summing the expression. This is a problem when the expression is an Average and I want the total aggregation to be an average as well.

- Mark as New
- Bookmark
- Subscribe
- Mute
- Subscribe to RSS Feed
- Permalink
- Report Inappropriate Content
Have you already tried using Dimensionality() or Aggr() function to get this resolved?
- Mark as New
- Bookmark
- Subscribe
- Mute
- Subscribe to RSS Feed
- Permalink
- Report Inappropriate Content
I haven't yet but do you have an example of what it might look like?
Robby
- Mark as New
- Bookmark
- Subscribe
- Mute
- Subscribe to RSS Feed
- Permalink
- Report Inappropriate Content
In general -
Dimensionality:
The second dimension... or how to use secondarydimensionality()
Aggr():
https://www.analyticsvidhya.com/blog/2014/02/aggr/
Particularly for your example it would be helpful if you can provide a sample, even dummy data will work, but a sample with expectation of an output will be very helpful in getting you to your final result.
- Mark as New
- Bookmark
- Subscribe
- Mute
- Subscribe to RSS Feed
- Permalink
- Report Inappropriate Content
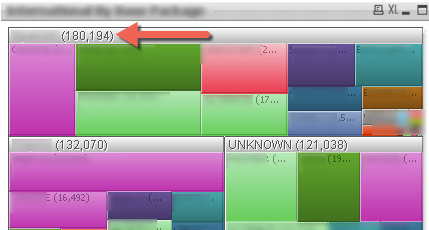
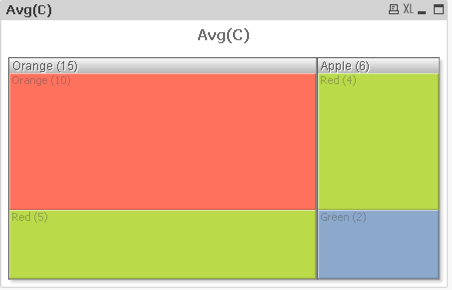
In its simplest form if you look at the picture I posted where it shows 180,194. I want this to be an avg instead of a sum.
If I gave you a data set that had
Apple Green 2
Apple Red 4
Orange Red 5
Orange Orange 10
The total field should show 3 instead of 6 for Apple and 7.5 for Orange instead of 15. Currently the total will only SUM the expression which is a problem if the expression is an average.
