Unlock a world of possibilities! Login now and discover the exclusive benefits awaiting you.
- Qlik Community
- :
- All Forums
- :
- QlikView App Dev
- :
- Re: Bubble chart
- Subscribe to RSS Feed
- Mark Topic as New
- Mark Topic as Read
- Float this Topic for Current User
- Bookmark
- Subscribe
- Mute
- Printer Friendly Page
- Mark as New
- Bookmark
- Subscribe
- Mute
- Subscribe to RSS Feed
- Permalink
- Report Inappropriate Content
Bubble chart
Hi,
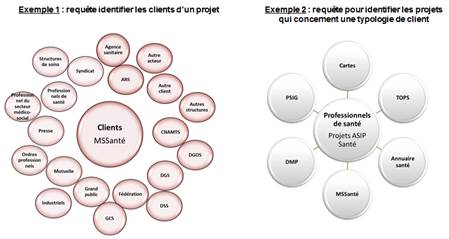
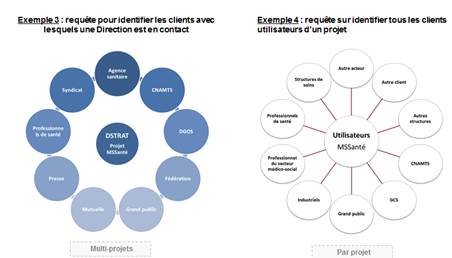
I need to implement the following dataviz (see attached document) in Qlik v11
How to get these bubble charts ?
Does any library already exist somewhere ?
How to integrate it in my app ?
Som nay questions
Thanks for your help
Bonjour,
On me demande de produire les datavisualisations sivantes (en PJ) en Qlik v11
Comment faire ces bubble chart ?
Extension a jouter, à coder ?
Il existe quelque chose dans les librairies ?
Tant de questions 🙂
merci pour votre aide
- Mark as New
- Bookmark
- Subscribe
- Mute
- Subscribe to RSS Feed
- Permalink
- Report Inappropriate Content
Hi Hoang,
If the position of the bubbles are static in number and position you can use images (text objects) and upon them another text objects with expressions, labels, etc.
If the bubbles are dinamyc you should look for an extension.
Regards,
H
- Mark as New
- Bookmark
- Subscribe
- Mute
- Subscribe to RSS Feed
- Permalink
- Report Inappropriate Content
Thank you martin
In fact it is a viszualisation for a very simple request
eg. all the customer buing a product
The object should accept as parameter the name of the 'product'
and using the in memory data module and another parameter as 'customer'
then display in the central buble the name of the product and all around it in different bubles all the the different customers name that bought it
easy requirment but hard to make (or not)
- Mark as New
- Bookmark
- Subscribe
- Mute
- Subscribe to RSS Feed
- Permalink
- Report Inappropriate Content
Hoang,
If you use different text boxes with images instead of colored-background, you can simulate those non QlikView native charts. You can play with hide conditions in order to show or hide some bubbles and only have visble those you need in each moment.
Hope it serves to orientate you.
Regards,
H
- Mark as New
- Bookmark
- Subscribe
- Mute
- Subscribe to RSS Feed
- Permalink
- Report Inappropriate Content
Can you share some sample data to play around to see?
- Mark as New
- Bookmark
- Subscribe
- Mute
- Subscribe to RSS Feed
- Permalink
- Report Inappropriate Content


- Mark as New
- Bookmark
- Subscribe
- Mute
- Subscribe to RSS Feed
- Permalink
- Report Inappropriate Content
it is just a representation of a TOP X returned for any request. in the center the purpose of the request. around the top 10 or 20 attributes returned by the request. If the position in the top can be visible (colore, size of the circles) it would be a nice to have !