Unlock a world of possibilities! Login now and discover the exclusive benefits awaiting you.
- Qlik Community
- :
- All Forums
- :
- QlikView App Dev
- :
- Re: Bubble color in Scatter Chart
- Subscribe to RSS Feed
- Mark Topic as New
- Mark Topic as Read
- Float this Topic for Current User
- Bookmark
- Subscribe
- Mute
- Printer Friendly Page
- Mark as New
- Bookmark
- Subscribe
- Mute
- Subscribe to RSS Feed
- Permalink
- Report Inappropriate Content
Bubble color in Scatter Chart
Hi All,
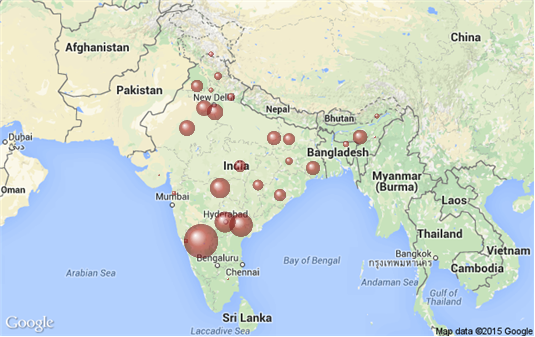
I am using Google Map in my application. Can any one suggest how should I change Bubble color in this Scatter Chart.
Thanks in advance.
- Tags:
- new_to_qlikview
- Mark as New
- Bookmark
- Subscribe
- Mute
- Subscribe to RSS Feed
- Permalink
- Report Inappropriate Content
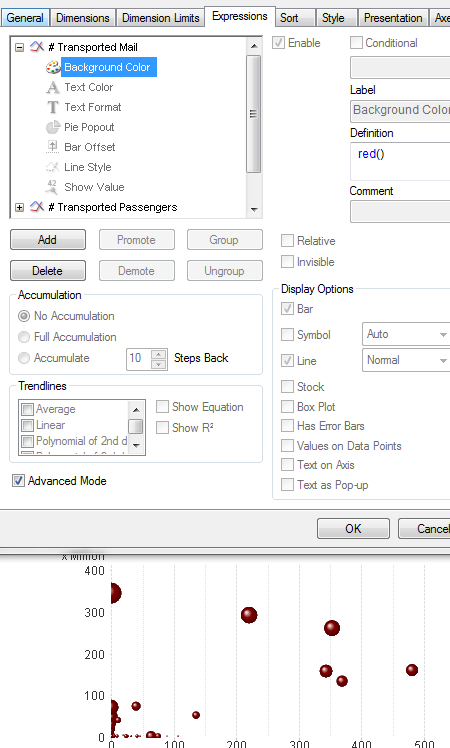
Go to one of the expression in expression tab
click on + sign
under background color definition add any color you want
i.e. RGB(100,20,40)
- Mark as New
- Bookmark
- Subscribe
- Mute
- Subscribe to RSS Feed
- Permalink
- Report Inappropriate Content
Hi Manish,
Thanks for your reply..Actually I want to add different color for each state. How I will do this?
Please help.
- Mark as New
- Bookmark
- Subscribe
- Mute
- Subscribe to RSS Feed
- Permalink
- Report Inappropriate Content
- Mark as New
- Bookmark
- Subscribe
- Mute
- Subscribe to RSS Feed
- Permalink
- Report Inappropriate Content
Hie..
I think you have to make expression in "under background color definition"..
Example:
if(State='MAH',Red(),
if(State='GUJ',Yellow(),
if(State='UP',Green(),
if(State='AP',Pink()
)))
Hope this will helps you...!!!
Regards,
Mohammad
- Mark as New
- Bookmark
- Subscribe
- Mute
- Subscribe to RSS Feed
- Permalink
- Report Inappropriate Content
Either use IF condition or use Colors in charts
- Mark as New
- Bookmark
- Subscribe
- Mute
- Subscribe to RSS Feed
- Permalink
- Report Inappropriate Content
Hi as @manish kachhia and Mohammad said, we need to add the expression back ground color.
Based on the requirement we should give different conditions along with the color codes.
- Mark as New
- Bookmark
- Subscribe
- Mute
- Subscribe to RSS Feed
- Permalink
- Report Inappropriate Content
Hi Soha,
check if you have a background colour set for your first expression,
if you have, then remove it and they should then appear in different colours

HTH - Andy