Unlock a world of possibilities! Login now and discover the exclusive benefits awaiting you.
- Qlik Community
- :
- All Forums
- :
- QlikView App Dev
- :
- Re: Calculate the relative percent in a line chart
- Subscribe to RSS Feed
- Mark Topic as New
- Mark Topic as Read
- Float this Topic for Current User
- Bookmark
- Subscribe
- Mute
- Printer Friendly Page
- Mark as New
- Bookmark
- Subscribe
- Mute
- Subscribe to RSS Feed
- Permalink
- Report Inappropriate Content
Calculate the relative percent in a line chart
This seems like it should be simple... I have a simple line chart showing the percent of the total population each ethnicity represents. Or at least that's what I want. But there doesn't appear to be an easy way to calculate this percentage. The graph below gives a general idea of what I'm trying to do, but you'll notice that for each year, the different ethnicity populations do not total to 100% because the the "relative" option just computes a TOTAL over all dimensions, which since I have both ethnicity and year as dimensions, is not correct.
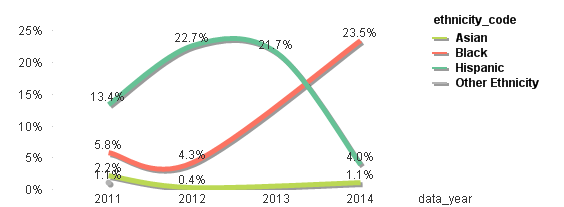
How can I tell the chart to compute the percentage for EACH YEAR rather than over all years??
- Tags:
- expression
- relative
Accepted Solutions
- Mark as New
- Bookmark
- Subscribe
- Mute
- Subscribe to RSS Feed
- Permalink
- Report Inappropriate Content
Hi Brian,
See attached example.
Basically I do this: sum(yourfield)/sum(Total <Year> yourfield)
The 'Total <Year>' will ignore ethnicity as a dimension and allow you to sum all records per year, which you need to so you can create a proportion that adds to 1 per year.
Hope that helps.
Matt
- Mark as New
- Bookmark
- Subscribe
- Mute
- Subscribe to RSS Feed
- Permalink
- Report Inappropriate Content
Hi,
Try this expression
=Sum(MeasureName)/Sum(TOTAL<Year> MeasureName)
This will calculate the percentages by Year, ignoring the Ethnicity_Code dimension. Hope this helps you.
Regards,
Jagan.
- Mark as New
- Bookmark
- Subscribe
- Mute
- Subscribe to RSS Feed
- Permalink
- Report Inappropriate Content
Hi Brian,
Were you able to resolve this?
Best,
Matt
- Mark as New
- Bookmark
- Subscribe
- Mute
- Subscribe to RSS Feed
- Permalink
- Report Inappropriate Content
Not exactly. I think something else might be impacting what's happening here. I actually had my expression set up to do exactly what the other commenters suggested:
sum({Global<subject_code=, assessment_code=> * HomeSchool}number_ethnicity_gender_enrolled) / sum({Global<subject_code=, assessment_code=, data_year=> * HomeSchool} TOTAL number_ethnicity_gender_enrolled)
I use states pretty heavily in this dashboard. So it's a bit convoluted...
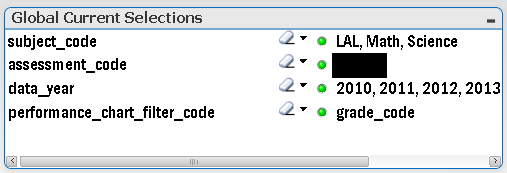
The Global state:
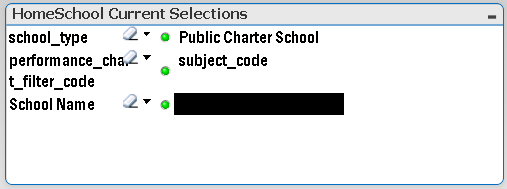
The HomeSchool State
The population that's left after the set analysis is a single school's records, for all years. I thought that the above formula would work as well, but it hasn't and I've tried a few different variations, but still cannot get the correct percentage...
- Mark as New
- Bookmark
- Subscribe
- Mute
- Subscribe to RSS Feed
- Permalink
- Report Inappropriate Content
My mistake, I did not have the formula you suggested. It's amazing the tricks your eyes can play on you after a long day... So having the TOTAL <data_year> before my set analysis did the trick...
sum({Global<subject_code=, assessment_code=, data_year=> * HomeSchool}number_ethnicity_gender_enrolled) / sum(TOTAL<data_year> {Global<subject_code=, assessment_code=> * HomeSchool} number_ethnicity_gender_enrolled)
I was not aware TOTAL was being treated as a set, I just thought it was a keyword. Is that what's happening here?
- Mark as New
- Bookmark
- Subscribe
- Mute
- Subscribe to RSS Feed
- Permalink
- Report Inappropriate Content
Good to hear, glad it worked out.
best,
Matt
- Mark as New
- Bookmark
- Subscribe
- Mute
- Subscribe to RSS Feed
- Permalink
- Report Inappropriate Content
This worked well - cheers