Unlock a world of possibilities! Login now and discover the exclusive benefits awaiting you.
- Qlik Community
- :
- All Forums
- :
- QlikView App Dev
- :
- Calculated Condition
- Subscribe to RSS Feed
- Mark Topic as New
- Mark Topic as Read
- Float this Topic for Current User
- Bookmark
- Subscribe
- Mute
- Printer Friendly Page
- Mark as New
- Bookmark
- Subscribe
- Mute
- Subscribe to RSS Feed
- Permalink
- Report Inappropriate Content
Calculated Condition
Hi
Question1 :
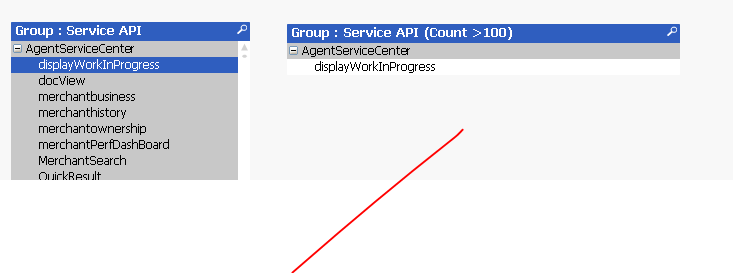
I have a Filter ( Group : Service API) and a Table with Multiple Dimensions and Expressions
I need to Show values in the Filter only if their related Count in the Table is >100 , need to have a Button or something which says to Show All or (Show Values where Count if greater than 100) by clicking which the Table and Filter should reflect the values.
I know that we can do this by using Button action and activating the related Filter and TableS , but how do I restrict the Filter valueS and Table Values WHERE count is >100
Question 2
I have 2 Charts below the Table , which should appear only when User select a Group and a Service API , if User selects Just the Group then it should display a message asking to select a ServiceAPI value also
How do I achieve this
Attached my application
Thanks
- « Previous Replies
-
- 1
- 2
- Next Replies »
Accepted Solutions
- Mark as New
- Bookmark
- Subscribe
- Mute
- Subscribe to RSS Feed
- Permalink
- Report Inappropriate Content
1) You probably need to add also ServiceTimeSeries.Date into your advanced aggregations to get the correct count
=aggr(If( sum({<ServiceTimeSeries.Date={'>=$(=Date(vStartDate))<=$(=Date(vEndDate))'}>}RequestCount_All) >100,[Group-Function]), [Group-Function], ServiceTimeSeries.Date)
But this will then also implicitely select the dates.
2) Maybe like
=Sum( aggr(If( sum({<ServiceTimeSeries.Date={'>=$(=Date(vStartDate))<=$(=Date(vEndDate))'}>}RequestCount_All) >100,1), [Group-Function], ServiceTimeSeries.Date))
- Mark as New
- Bookmark
- Subscribe
- Mute
- Subscribe to RSS Feed
- Permalink
- Report Inappropriate Content
Regarding your second question:
You can set show conditions on layout tab of your bottom two charts.
Since your left list box already uses a combined field made of Group and Function, you can just use
=GetSelectedCount([Group-Function]) =1
[Or check >0 if you are happy with any selections, not only with a single value selected.]
- Mark as New
- Bookmark
- Subscribe
- Mute
- Subscribe to RSS Feed
- Permalink
- Report Inappropriate Content
My question is slightly different I , yes it is a concatenation of 2 fields separated as a tree view by colon ": ", there is a use case of selecting just Group , so I don't want charts to display when user selects just group infact I want the charts to be displayed when user selects both group and service api .. so my approach was to find a value which has ":" and if user selects any value with : then the chart appears if not msg saying select an service api
Please let me know if there is any other better way to do this which covers all use cases
- Mark as New
- Bookmark
- Subscribe
- Mute
- Subscribe to RSS Feed
- Permalink
- Report Inappropriate Content
If you want to check if there is a ':' in the selected values of Group-Function:
=SubstringCount(GetFieldSelections([Group-Function]),':')
- Mark as New
- Bookmark
- Subscribe
- Mute
- Subscribe to RSS Feed
- Permalink
- Report Inappropriate Content
Thank you .. This worked ! Any help on Question 1 ?
I need to Show chart where Count in the Table is >100 .. I figured out to set the Filter values where related count is >100 .. just the chart not sure how I can get the complete chart just showing the values where count is >100
- Mark as New
- Bookmark
- Subscribe
- Mute
- Subscribe to RSS Feed
- Permalink
- Report Inappropriate Content
One possible solution would be to make every expression return zero if the count >100, like for your count expression
=If( sum({<ServiceTimeSeries.Date={'>=$(=Date(vStartDate))<=$(=Date(vEndDate))'}>}RequestCount_All) >100,
sum({<ServiceTimeSeries.Date={'>=$(=Date(vStartDate))<=$(=Date(vEndDate))'}>}RequestCount_All) ,0)
All other expression could check the Count like
=If( "Count", OtherExpression)
If all expressions return zero for a table chart line, the line will be hidden if 'suppress zero values' is enabled on presentation tab.
You can enhance above with an additional logic & variable to make the comparison dynamic by value and enable / disable.
- Mark as New
- Bookmark
- Subscribe
- Mute
- Subscribe to RSS Feed
- Permalink
- Report Inappropriate Content
Great , one last thing , I have the filter list box expression for GroupFunction , to display values only when count is >100 , is this correct way to do this?
=if(aggr(sum({<ServiceTimeSeries.Date={'>=$(=Date(vStartDate))<=$(=Date(vEndDate))'}>}RequestCount_All),[Group-Function])>100,[Group-Function])
And also I wanted to display the number of rows in Caption for the chart , I had the below expression earlier , but this even counts the Dates with Zero values .. how can I avoid it ?
='Rows: '& Count({<ServiceTimeSeries.Date={'>=$(=Date(vStartDate))<=$(=Date(vEndDate))'}>}ServiceTimeSeries.Date)
- Mark as New
- Bookmark
- Subscribe
- Mute
- Subscribe to RSS Feed
- Permalink
- Report Inappropriate Content
Attached your modified sample QVW with above suggested solution.
- Mark as New
- Bookmark
- Subscribe
- Mute
- Subscribe to RSS Feed
- Permalink
- Report Inappropriate Content
1) You probably need to add also ServiceTimeSeries.Date into your advanced aggregations to get the correct count
=aggr(If( sum({<ServiceTimeSeries.Date={'>=$(=Date(vStartDate))<=$(=Date(vEndDate))'}>}RequestCount_All) >100,[Group-Function]), [Group-Function], ServiceTimeSeries.Date)
But this will then also implicitely select the dates.
2) Maybe like
=Sum( aggr(If( sum({<ServiceTimeSeries.Date={'>=$(=Date(vStartDate))<=$(=Date(vEndDate))'}>}RequestCount_All) >100,1), [Group-Function], ServiceTimeSeries.Date))
- Mark as New
- Bookmark
- Subscribe
- Mute
- Subscribe to RSS Feed
- Permalink
- Report Inappropriate Content
One thing I noticed after using the below expression for the Group Filter the values I cannot expand all the time , as soon as I select a value it collapses, is this because I am using an expression?
- « Previous Replies
-
- 1
- 2
- Next Replies »