Unlock a world of possibilities! Login now and discover the exclusive benefits awaiting you.
- Qlik Community
- :
- All Forums
- :
- QlikView App Dev
- :
- Re: Calculated Dimension - Age Buckets using Aggr?
- Subscribe to RSS Feed
- Mark Topic as New
- Mark Topic as Read
- Float this Topic for Current User
- Bookmark
- Subscribe
- Mute
- Printer Friendly Page
- Mark as New
- Bookmark
- Subscribe
- Mute
- Subscribe to RSS Feed
- Permalink
- Report Inappropriate Content
Calculated Dimension - Age Buckets using Aggr?
Hi,
I need to create a chart where I'm able to dynamically group employees into age buckets based on user input.
E.g. Table contains data similar to the following
Emp ID Age
1 29
2 35
3 48
4 34
I'd like to create age buckets 20-29, 30-39, 40-49 etc...
There will be a variable that represents the calendar year and it can be adjusted by the user via slider input.
E.g. User slides from 2016 to 2020.
I would then add the variable to the age via Age + $(variable) in order to re-calculate the age bucket distribution.
Does anybody know how I can achieve this using aggr()?
Thanks.
Accepted Solutions
- Mark as New
- Bookmark
- Subscribe
- Mute
- Subscribe to RSS Feed
- Permalink
- Report Inappropriate Content
Hi Gavin,
You can use Class() function :
=Aggr(Class(Age+(vYear-Year(Today())),10,'Age'),ID)
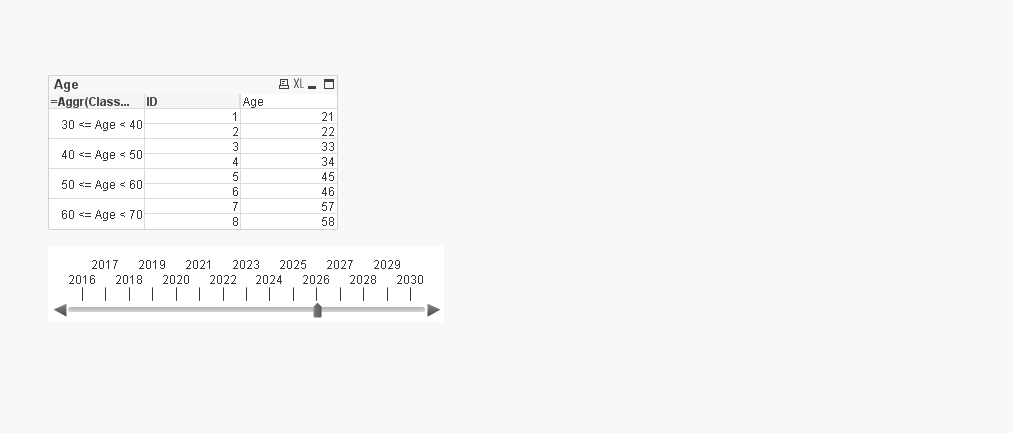
See Attachment.
Regards,
Antonio
- Mark as New
- Bookmark
- Subscribe
- Mute
- Subscribe to RSS Feed
- Permalink
- Report Inappropriate Content
You can add the band in the script as follows.
load empid, age, if (age >=20 and age <=29, '20-29',
if(age >=30 and age <=39, '30-39'...
) as AgeBand
resident
<table>;
when you say your age bucket changes when using the slider do you calculate the age dynamically based on a date field? Please explain a little more.
- Mark as New
- Bookmark
- Subscribe
- Mute
- Subscribe to RSS Feed
- Permalink
- Report Inappropriate Content
Hi Gavin,
You can use Class() function :
=Aggr(Class(Age+(vYear-Year(Today())),10,'Age'),ID)
See Attachment.
Regards,
Antonio
- Mark as New
- Bookmark
- Subscribe
- Mute
- Subscribe to RSS Feed
- Permalink
- Report Inappropriate Content
Hi Antonio,
Many thanks for the sample approach!
I also found that using a combination of Pick and If statements allows one to create buckets with tailored messages as well.