Unlock a world of possibilities! Login now and discover the exclusive benefits awaiting you.
- Qlik Community
- :
- All Forums
- :
- QlikView App Dev
- :
- Re: Calculated Dimension for Pivot Table
- Subscribe to RSS Feed
- Mark Topic as New
- Mark Topic as Read
- Float this Topic for Current User
- Bookmark
- Subscribe
- Mute
- Printer Friendly Page
- Mark as New
- Bookmark
- Subscribe
- Mute
- Subscribe to RSS Feed
- Permalink
- Report Inappropriate Content
Calculated Dimension for Pivot Table
Hi
I want to to create a table like the one shown in the image below.
I have the following dimensions:
Day
Week
BultoStock
KiloStock
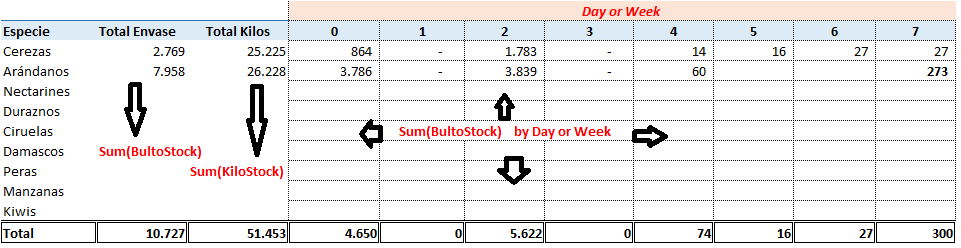
Any idea how to do this?
I think this can be done with calculated dimension, but cannot make it work!
Accepted Solutions
- Mark as New
- Bookmark
- Subscribe
- Mute
- Subscribe to RSS Feed
- Permalink
- Report Inappropriate Content
In Dimension for sum()
=aggr(sum(BultoStock),Especie)
=aggr(sum(KiloStock),Especie)
Also you need the following dimension
Especie
day/week
Expression :
Sum(BultoStock)
Thanks
- Mark as New
- Bookmark
- Subscribe
- Mute
- Subscribe to RSS Feed
- Permalink
- Report Inappropriate Content
Would you be able to share some sample raw data and explain the expected output?
- Mark as New
- Bookmark
- Subscribe
- Mute
- Subscribe to RSS Feed
- Permalink
- Report Inappropriate Content
In Dimension for sum()
=aggr(sum(BultoStock),Especie)
=aggr(sum(KiloStock),Especie)
Also you need the following dimension
Especie
day/week
Expression :
Sum(BultoStock)
Thanks
- Mark as New
- Bookmark
- Subscribe
- Mute
- Subscribe to RSS Feed
- Permalink
- Report Inappropriate Content
Thanks!
It works, but I can't show the Totals for the grouped dimensions. Any idea about how to do it?
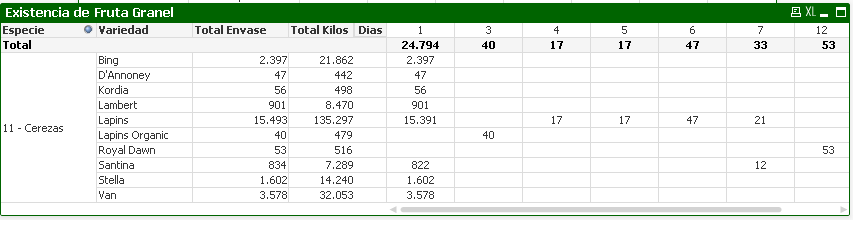
If I use the "Show partial Sums", I get the following:
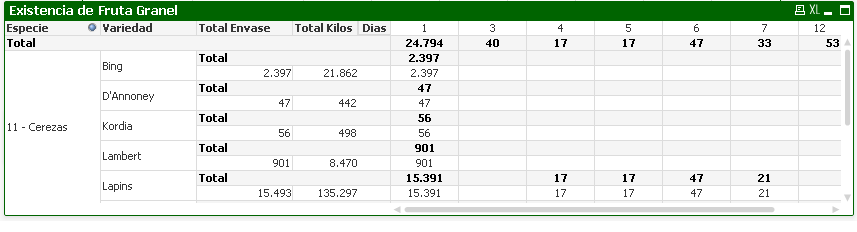
I've tried drag&drop but cannot make it work!
- Mark as New
- Bookmark
- Subscribe
- Mute
- Subscribe to RSS Feed
- Permalink
- Report Inappropriate Content
Totals for the group dimension won't be possible, as Totals works only for Expressions.
- Mark as New
- Bookmark
- Subscribe
- Mute
- Subscribe to RSS Feed
- Permalink
- Report Inappropriate Content
I Solved it by putting another pivot table over the principal one.
Then I've hide the borders, change the background color.. and nobody will notice it hehe 
- Mark as New
- Bookmark
- Subscribe
- Mute
- Subscribe to RSS Feed
- Permalink
- Report Inappropriate Content
. Problem might come when users does selections. So test and Test:)