Unlock a world of possibilities! Login now and discover the exclusive benefits awaiting you.
- Qlik Community
- :
- All Forums
- :
- QlikView App Dev
- :
- Calculated Expression not displaying in Bar Graph
- Subscribe to RSS Feed
- Mark Topic as New
- Mark Topic as Read
- Float this Topic for Current User
- Bookmark
- Subscribe
- Mute
- Printer Friendly Page
- Mark as New
- Bookmark
- Subscribe
- Mute
- Subscribe to RSS Feed
- Permalink
- Report Inappropriate Content
Calculated Expression not displaying in Bar Graph
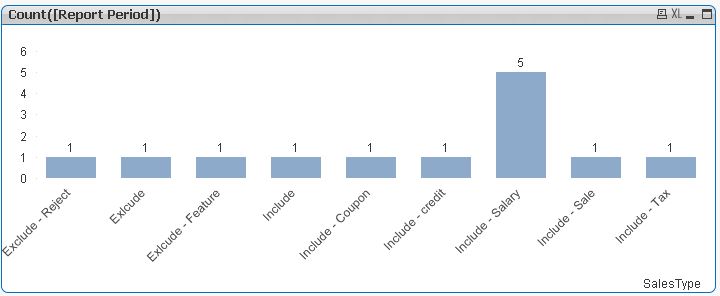
I want to create a bar graph that counts the total of sales types for each reporting period. However I want to combine all the 'Include' records in one graph (stacked... but not separated by each 'sales type')
Report Period SalesType
1 Include
1 Exlcude
1 Include - Sale
1 Include - Tax
1 Include - credit
1 Include - Coupon
1 Exclude - Reject
1 Exlcude - Feature
1 Include - Salary
1 Include - Salary
1 Include - Salary
1 Include - Salary
1 Include - Salary
Desired End Result:
Include: 10
Exclude: 1
Exclude - Reject: 1
Exclude - Feature: 1
I tried creating separate expressions for each count but when I do this only 1 graph is displayed. Please Help!
Exp1: =Count ({<SalesType={'Include','Include - Sale','Include - Tax','Include - credit','Include - Coupon'}>} SalesType)
Exp2: =Count ({<SalesType={'Exclude'}>} SalesType)
Accepted Solutions
- Mark as New
- Bookmark
- Subscribe
- Mute
- Subscribe to RSS Feed
- Permalink
- Report Inappropriate Content
- Mark as New
- Bookmark
- Subscribe
- Mute
- Subscribe to RSS Feed
- Permalink
- Report Inappropriate Content
Example of bar Graph not displaying correctly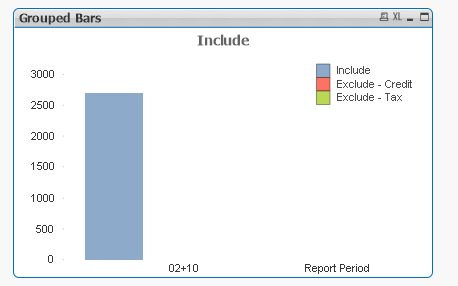
- Mark as New
- Bookmark
- Subscribe
- Mute
- Subscribe to RSS Feed
- Permalink
- Report Inappropriate Content
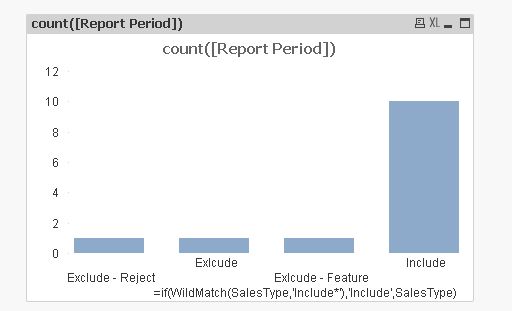 You need calculated dimension
=if(WildMatch(SalesType,'Include*'),'Include',SalesType)
- Mark as New
- Bookmark
- Subscribe
- Mute
- Subscribe to RSS Feed
- Permalink
- Report Inappropriate Content
Would you be able to share your qvw file?
- Mark as New
- Bookmark
- Subscribe
- Mute
- Subscribe to RSS Feed
- Permalink
- Report Inappropriate Content
and expression will be count([Report Period])
- Mark as New
- Bookmark
- Subscribe
- Mute
- Subscribe to RSS Feed
- Permalink
- Report Inappropriate Content
could you please add the qvw?
- Mark as New
- Bookmark
- Subscribe
- Mute
- Subscribe to RSS Feed
- Permalink
- Report Inappropriate Content
Like this,
- Mark as New
- Bookmark
- Subscribe
- Mute
- Subscribe to RSS Feed
- Permalink
- Report Inappropriate Content
pfa
- Mark as New
- Bookmark
- Subscribe
- Mute
- Subscribe to RSS Feed
- Permalink
- Report Inappropriate Content
Thank you!!!!
- Mark as New
- Bookmark
- Subscribe
- Mute
- Subscribe to RSS Feed
- Permalink
- Report Inappropriate Content
Glad to know it worked 