Unlock a world of possibilities! Login now and discover the exclusive benefits awaiting you.
- Qlik Community
- :
- All Forums
- :
- QlikView App Dev
- :
- Re: Calculating in a Table
- Subscribe to RSS Feed
- Mark Topic as New
- Mark Topic as Read
- Float this Topic for Current User
- Bookmark
- Subscribe
- Mute
- Printer Friendly Page
- Mark as New
- Bookmark
- Subscribe
- Mute
- Subscribe to RSS Feed
- Permalink
- Report Inappropriate Content
Calculating in a Table
Made some SQL queries that gives me some Data, now I want to calculate whit this data, like in an excel sheet. As I noticed, I cannot calculate whit a Tablebox (only in SQL and transfer this to the Tablebox). But it should be possible whit a Chart Straight Table or Pivot. But somehow I don't understand the logic of this. : https://help.qlik.com/en-US/qlikview/12.0/Subsystems/Client/Content/Straight_Table.htm
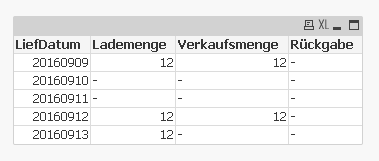
The data I receive whit my first ever query in QlikView looks like this (see attachment) . First column is the date, that one is fixed. The next 3 are Stock values (adding, sale and return). Now, in the next column there had to be the calculation. In the first row starting whit an inventory number, and than in the second use the value from above )the first row) and add those 3 values.
/edit: I noticed that if the calculation equals Zero that the whole row disappears.
/edit2: getting further and further. It seems to work now, after some isnull statements in the query and some other changes. But now i want that to calculate whit the outcome of the previous row. Is that possible?
- Mark as New
- Bookmark
- Subscribe
- Mute
- Subscribe to RSS Feed
- Permalink
- Report Inappropriate Content
Hi Roman,
I can´t understand you so well, but I think that you can use bellow.
Maybe you can attach a sample data or script.
Regards
Miguel del Valle
- Mark as New
- Bookmark
- Subscribe
- Mute
- Subscribe to RSS Feed
- Permalink
- Report Inappropriate Content
HI Miguel,
I often have the problem that people don't understand me. It's a curse....
But till now I figured out that I can put my data into a Diagram Table, that worked well, and even the calculation worked good for the first time. If needed I could paste my SQL queries also, but I don't think that those are needed.
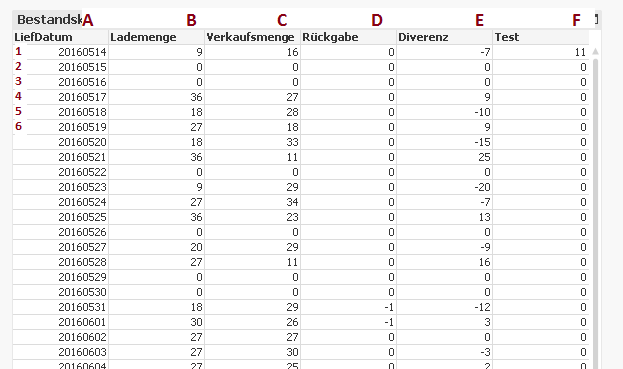
But now I want to calculate whit a value I got from the line above. I added a picture whit some Excel numbering.
You see column A is just a Date, column B C and D are fetched from the SQL query (meaning delivery, sale and return). Column E is the difference between B C and D. (in excel terms E1=B1-C1+D1). This column is just for testing purpose and will be removed or disabled later on.
Now what I want is the outcome in Column F (at this moment called Test). The first one (F1) holds the value from the last Inventory. That value is also fetched from a SQL query, and I figured out that I can use IF statements in Diagrams, so I did a "If(LiefDatum = upd_dat,imenge,'0')". So if Deliverydate equals the inventorydate than put there the inventory value. This worked also, resulting in the value 11 in Cell F1.
And now the problematic part. In the next cell (F2) I want to use the value from F1. In excel terms F2=F1+E2. and so on. So that I see the actual quantity per day that are in stock.
A little background info. I'm working at a company whit mobile shops. Trucks whit goods like milk, bread, and everything you need for living, Each truck is a treated as a warehouse in SQL, so it has a Stock. And sometime we have to find irregularities. Now I have and SQL script and use TOAD and Excel for this, but I would be nice (say less work) if it is all in one.
- Mark as New
- Bookmark
- Subscribe
- Mute
- Subscribe to RSS Feed
- Permalink
- Report Inappropriate Content
Simply create a Pivot table:
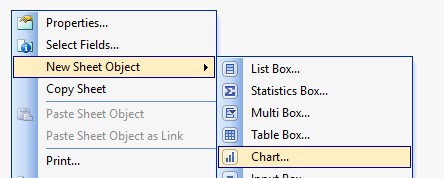
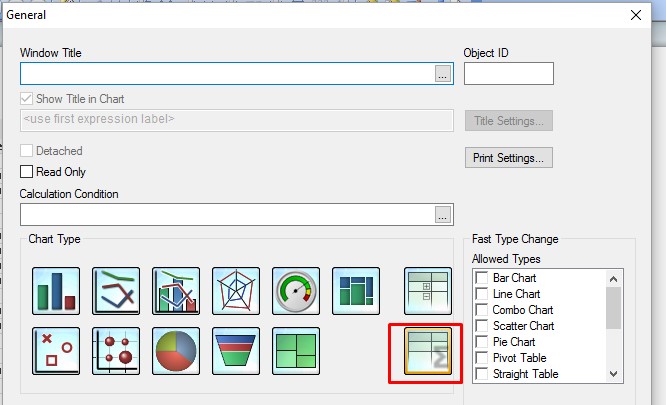
Next
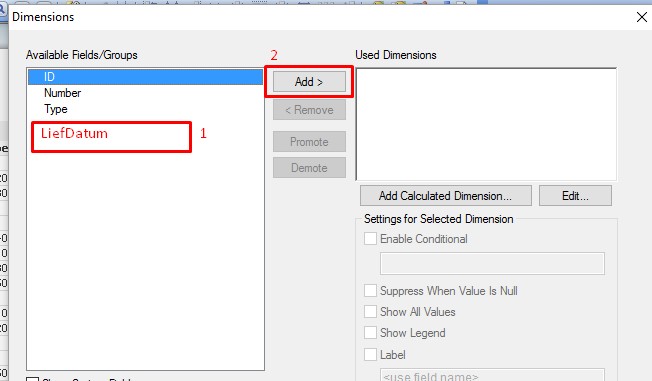
Next
Ok
Next Next until you reach Finish.
- Mark as New
- Bookmark
- Subscribe
- Mute
- Subscribe to RSS Feed
- Permalink
- Report Inappropriate Content
I suggest that you upload a sample and explain in detail what calculcations you need and what results you expect. See below for more:
Qlik Community Tip: Posting Successful Discussion Threads
QlikCommunity Tip: How to get answers to your post?
Preparing examples for Upload - Reduction and Data Scrambling
- Mark as New
- Bookmark
- Subscribe
- Mute
- Subscribe to RSS Feed
- Permalink
- Report Inappropriate Content
Somebody any idea?
/edit: I think I made it.. use the use of the function called "Above"
- Mark as New
- Bookmark
- Subscribe
- Mute
- Subscribe to RSS Feed
- Permalink
- Report Inappropriate Content
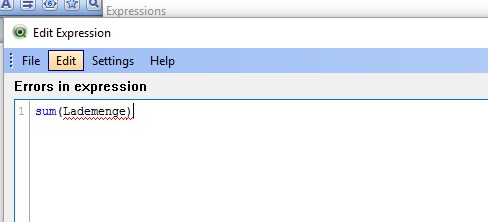
You can try defining the accumulation field as
=RangeSum(Above(Sum(Lademenge), 0, RowNo()))