Unlock a world of possibilities! Login now and discover the exclusive benefits awaiting you.
- Qlik Community
- :
- All Forums
- :
- QlikView App Dev
- :
- Can I filter in a "Table box"?
- Subscribe to RSS Feed
- Mark Topic as New
- Mark Topic as Read
- Float this Topic for Current User
- Bookmark
- Subscribe
- Mute
- Printer Friendly Page
- Mark as New
- Bookmark
- Subscribe
- Mute
- Subscribe to RSS Feed
- Permalink
- Report Inappropriate Content
Can I filter in a "Table box"?
Hi
| Ticket Number | FullOrder | Priority | Status_original | Tower | Analyst Group |
| 2565011 | 3 | 3 | Completed | zztop | AG001 |
| 2565011 | 1 | 3 | New | zztop | AG002 |
| 2565012 | 3 | 3 | Completed | zztop | AG003 |
| 2565012 | 2 | 3 | New | zztop | AG004 |
| 2565012 | 2 | 3 | New | zztop | AG001 |
| 2565013 | 2 | 3 | New | zztop | AG003 |
| 2565014 | 3 | 3 | Completed | zztop | AG007 |
| 2565014 | 2 | 3 | New | zztop | AG008 |
| 2565014 | 2 | 3 | New | zztop | AG001 |
| 2565014 | 1 | 3 | New | zztop | AG003 |
| 2565014 | 1 | 3 | New | zztop | AG003 |
| 2565014 | 1 | 3 | New | zztop | AG003 |
I have a table box who shows data like this. i would like show only the higher value of FullOrder for each Ticket Number. For example:
| Ticket Number | FullOrder | Priority | Status_original | Tower | Analyst Group |
| 2565011 | 3 | 3 | Completed | zztop | AG001 |
| 2565012 | 3 | 3 | Completed | zztop | AG003 |
| 2565013 | 2 | 3 | New | zztop | AG003 |
| 2565014 | 3 | 3 | Completed | zztop | AG007 |
I can show that using a chart, but i would like use a table box. how can i do it??
Thanks
- Mark as New
- Bookmark
- Subscribe
- Mute
- Subscribe to RSS Feed
- Permalink
- Report Inappropriate Content
Jose,
as i know, it is possible only if you load into application only those rows 
- Mark as New
- Bookmark
- Subscribe
- Mute
- Subscribe to RSS Feed
- Permalink
- Report Inappropriate Content
Can you not change the table box to a chart ?
- Mark as New
- Bookmark
- Subscribe
- Mute
- Subscribe to RSS Feed
- Permalink
- Report Inappropriate Content
or add a flag in the script and in tablebox suppress when flag is null
- Mark as New
- Bookmark
- Subscribe
- Mute
- Subscribe to RSS Feed
- Permalink
- Report Inappropriate Content
Hi all,
I think that this will be the only way. I suppose I will use a chart because the data change by date, and I would like show the higher value in the same day. For this reason, I can't use a flag or create another table in load script.
Thanks all.
- Mark as New
- Bookmark
- Subscribe
- Mute
- Subscribe to RSS Feed
- Permalink
- Report Inappropriate Content
Hi,
On the load script you can do this by adding one more table and then plot those tables fields on any table box
Source:
LOAD * Inline
[
Ticket, FullOrder, Priority, Status_original,Tower,Analyst Group
2565011, 3, 3, Completed, zztop, AG001
2565011, 1, 3, New, zztop, AG002
2565012, 3, 3, Completed, zztop, AG003
2565012, 2, 3, New, zztop, AG004
2565012, 2, 3, New, zztop, AG001
2565013, 2, 3, New, zztop, AG003
2565014, 3, 3, Completed, zztop, AG007
2565014, 2, 3, New, zztop, AG008
2565014, 2, 3, New, zztop, AG001
2565014, 1, 3, New, zztop, AG003
2565014, 1, 3, New, zztop, AG003
2565014, 1, 3, New, zztop, AG003
];
Add from here in your load script
//=================
tmpMax:
LOAD
Ticket as NewTicket,
MaxString(FullOrder) as NewFullOrder
Resident Source
Group By Ticket;
NoConcatenate
MaxTable:
LOAD
NewTicket&'_'&NewFullOrder as %Ticket_FullOrd,
NewTicket,
NewFullOrder Resident tmpMax;
DROP Table tmpMax;
Left Join
LOAD
Ticket&'_'&FullOrder as %Ticket_FullOrd,
Ticket,
[Status_original] as [New Status_original],
Tower as NewTower,
[Analyst Group] as [New Analyst Group]
Resident Source;
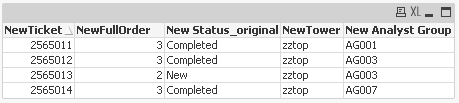
Note:- And then on the table box plot field values like
NewTicket,NewFullOrder,[New Status_original], NewTower, [New Analyst Group]
By this you get the output like
- Mark as New
- Bookmark
- Subscribe
- Mute
- Subscribe to RSS Feed
- Permalink
- Report Inappropriate Content
Jose,
chart of course will be better, because it will react on selections. It is natural way.
regards
Darek
- Mark as New
- Bookmark
- Subscribe
- Mute
- Subscribe to RSS Feed
- Permalink
- Report Inappropriate Content
the flag
a:
LOAD [Ticket Number],
FullOrder,
Priority,
Status_original,
Tower,
[Analyst Group]
FROM
[http://community.qlik.com/thread/119568]
(html, codepage is 1252, embedded labels, table is @1);
t:
NoConcatenate
load *, if(peek([Ticket Number])<>[Ticket Number],1) as flag
Resident a
order by [Ticket Number], FullOrder desc;
drop table a;