Unlock a world of possibilities! Login now and discover the exclusive benefits awaiting you.
- Qlik Community
- :
- All Forums
- :
- QlikView App Dev
- :
- Re: Can we have range(0-5,5-10,etc) in Y-axis of a...
- Subscribe to RSS Feed
- Mark Topic as New
- Mark Topic as Read
- Float this Topic for Current User
- Bookmark
- Subscribe
- Mute
- Printer Friendly Page
- Mark as New
- Bookmark
- Subscribe
- Mute
- Subscribe to RSS Feed
- Permalink
- Report Inappropriate Content
Can we have range(0-5,5-10,etc) in Y-axis of a Line chart
Hi All,
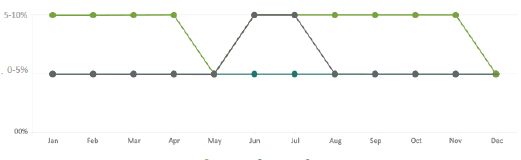
I have a situation, where i need to use range (0-5,5-10,etc) in Y axis of a Line chart.
As we are calculating growth so the values of Y-axis would be dynamic and accordingly the Y-axis should vary.
Below is the example of the same -
Please let me know if you have any solution for the same.
Regards,
Akshay
- Mark as New
- Bookmark
- Subscribe
- Mute
- Subscribe to RSS Feed
- Permalink
- Report Inappropriate Content
What I am confused about is the fact that does 0-5% represent a single number or a range? How can Jan data be within a range of 0-5%? or are you trying to ceil any percentage between 0-5% to be showed as 5%?
- Mark as New
- Bookmark
- Subscribe
- Mute
- Subscribe to RSS Feed
- Permalink
- Report Inappropriate Content
I don't think you can modify the Y-Axis labels, but you can group your values using the class function as below
Class([Growth],0.05)
Remove Y-axis labels and overlap with text boxes
If a post helps to resolve your issue, please accept it as a Solution.
- Mark as New
- Bookmark
- Subscribe
- Mute
- Subscribe to RSS Feed
- Permalink
- Report Inappropriate Content
Hi Sunny,
We are calculating growth as a single number but at the time of representation we want to show it in range.
For example -
If the growth is 1.2% then it should be shown as 0-5%,
if it is -1% then -(0-5%), if 5.6% the 5-10% and so on
Regards,
Akshay
- Mark as New
- Bookmark
- Subscribe
- Mute
- Subscribe to RSS Feed
- Permalink
- Report Inappropriate Content
So basically you are ceiling it because now 0-5% is a single point for the range, right?
I would do something like this:
Ceil(YourExpression, 0.05)
If this doesn't work, would you be able to provide a sample?
- Mark as New
- Bookmark
- Subscribe
- Mute
- Subscribe to RSS Feed
- Permalink
- Report Inappropriate Content
You can set Static Step on Axis Tab wih expression like
Max(Aggr(Growth,Month))/5
Regards,
Antonio
- Mark as New
- Bookmark
- Subscribe
- Mute
- Subscribe to RSS Feed
- Permalink
- Report Inappropriate Content
Hi Sunny,
Please find the attachment.
What is required in y-axis is 0-10%,10-20% and so on.